Absolute Vertical Yardage Based Offensive Scoring Efficiency
A mouthful and a counterintuitive new metric
Since yardage data started to be produced a couple of years ago, conversations around individual player performance have gotten more intriguing yet also more confusing. With a limited number of benchmarks (only time will fill those out), it can be difficult to compare players or performances. However, there are some basic but valuable nuances that came out: players that have negative receiving yards spend a lot of time in the backfield, while players with massive receiving yards are consistently chewing up yards downfield. But, with yardage being added for going upfield and subtracted for going backfield, we are still missing context as to the production of a player.
There's no doubt that it's a good start, but more context is always needed.
While I'm not focused on individual player yardage today, I will explore another aspect of yardage from a team focused, broader view. I'm not sure the best name for it, but for now I've settled on "Vertical Offensive Scoring Efficiency". That's not a catchy name and I've got no backronym for it, but hopefully it sufficiently explains the concept I'm getting at.
Vertical Offensive Scoring Efficiency is a measure of how many extra yards vertically a team has covered or gained in order to score. These yards are vertical because we are still talking about yardage gained/lossed in the North/South direction, similar to how yardage is currently tracked on the AUDL stat pages. (Side note: taking into account how far a disc moves left to right is quite important and shouldn't be neglected, but I'm going to focus on just one aspect in this post and tackle left/right yardage and disc movement another time.) This is different than just yardage gained on a possession because it is taking into account both backwards and forwards movement. Any movement that is vertical on the field. In other words, instead of just tracking net yardage gained, I am looking at absolute yardage gained.
Let me give a quick example. Suppose team A throws a 20 yard pass upfield and then immediately throws a 30 yard pass upfield for a goal. Team B throws a 20 yard pass upfield, resets the disc backwards 10 yards, and then throws a 40 yard huck for a goal. In both cases, the team has gained 50 yards of offense given the way we currently talk about yardage. However, I also want to take into account team B traveling an extra 20 yards in order to make the same goal happen. In a way, team B was less efficient at scoring than team A, though anecdotally, teams that are willing to move backwards in order to maintain possession and attack different angles don't seem to necessarily be less efficient teams. But for the sake of explanation I think you understand what I mean by "less efficient".
The "Scoring Efficiency" part plays in because I wanted to have the absolute yardage gained be relative to how far the team had to go in order to score. Let's go back to the example: team A gained 50 yards of offense as we track it today in the AUDL and also used 50 absolute vertical yards to score. The "inefficiency" on this scoring drive was 0%. Team B gained 50 yards of offense, but traveled an absolute 70 yards vertically in order to score. They had to gain (70 - 50) / 50 = 40% more yards than they "needed to" in order to score.
This is what I'm calling, for now anyways, Vertical Offensive Scoring Efficiency. It's the distance a team went in order to score relative to the net yards they gained in their scoring drive. In this post I'm always going to calculate it as a percentage to keep it relative.
Offensive Scoring Efficiency
Now that I've explained the concept of Vertical Offensive Scoring Efficiency, let's look at the bullet chart below.
This bullet chart has two "bars" for each team. The blue bar represents the average absolute yardage each team went in order to score over the course of the 2023 season so far. The white bar inside of the blue bar represents the average net yardage each team went in their scoring drives in 2023 so far. Thus, the percentage shown above each bar is the team's average Vertical Offensive Scoring Efficiency this year. I sorted the graph from "least efficient" (highest number) on the left down to the "most efficient" (lowest number) on the right. On average this season, the AlleyCats have gained over 50% more yards than needed on their scoring possessions this season! In other words, they have been willing to go backwards quite a bit on their successful scoring drives. On the other hand, Seattle and Boston seem to resist that type of play.
It's nice to get a little bit more granular, so below is a plot that shows the quarter by quarter efficiency for each team this season.
The horizontal line for each team is the average efficiency percentage that is seen in the previous bullet chart. Quarters that are above that average are outlined in gold, while the quarters that are below are outlined in blue. I don't know that these line graphs are immensely insightful, but it is interesting to see that San Diego starts their games with a very low metric (they do not reset the disc backwards hardly at all during the first quarter). On the other hand, LA and Philadelphia, compared to the rest of the game, are not very patient in the fourth quarter and tend to push the disc into the endzone more quickly on their scoring drives than in the previous three quarters.
Throws as another proxy for efficiency
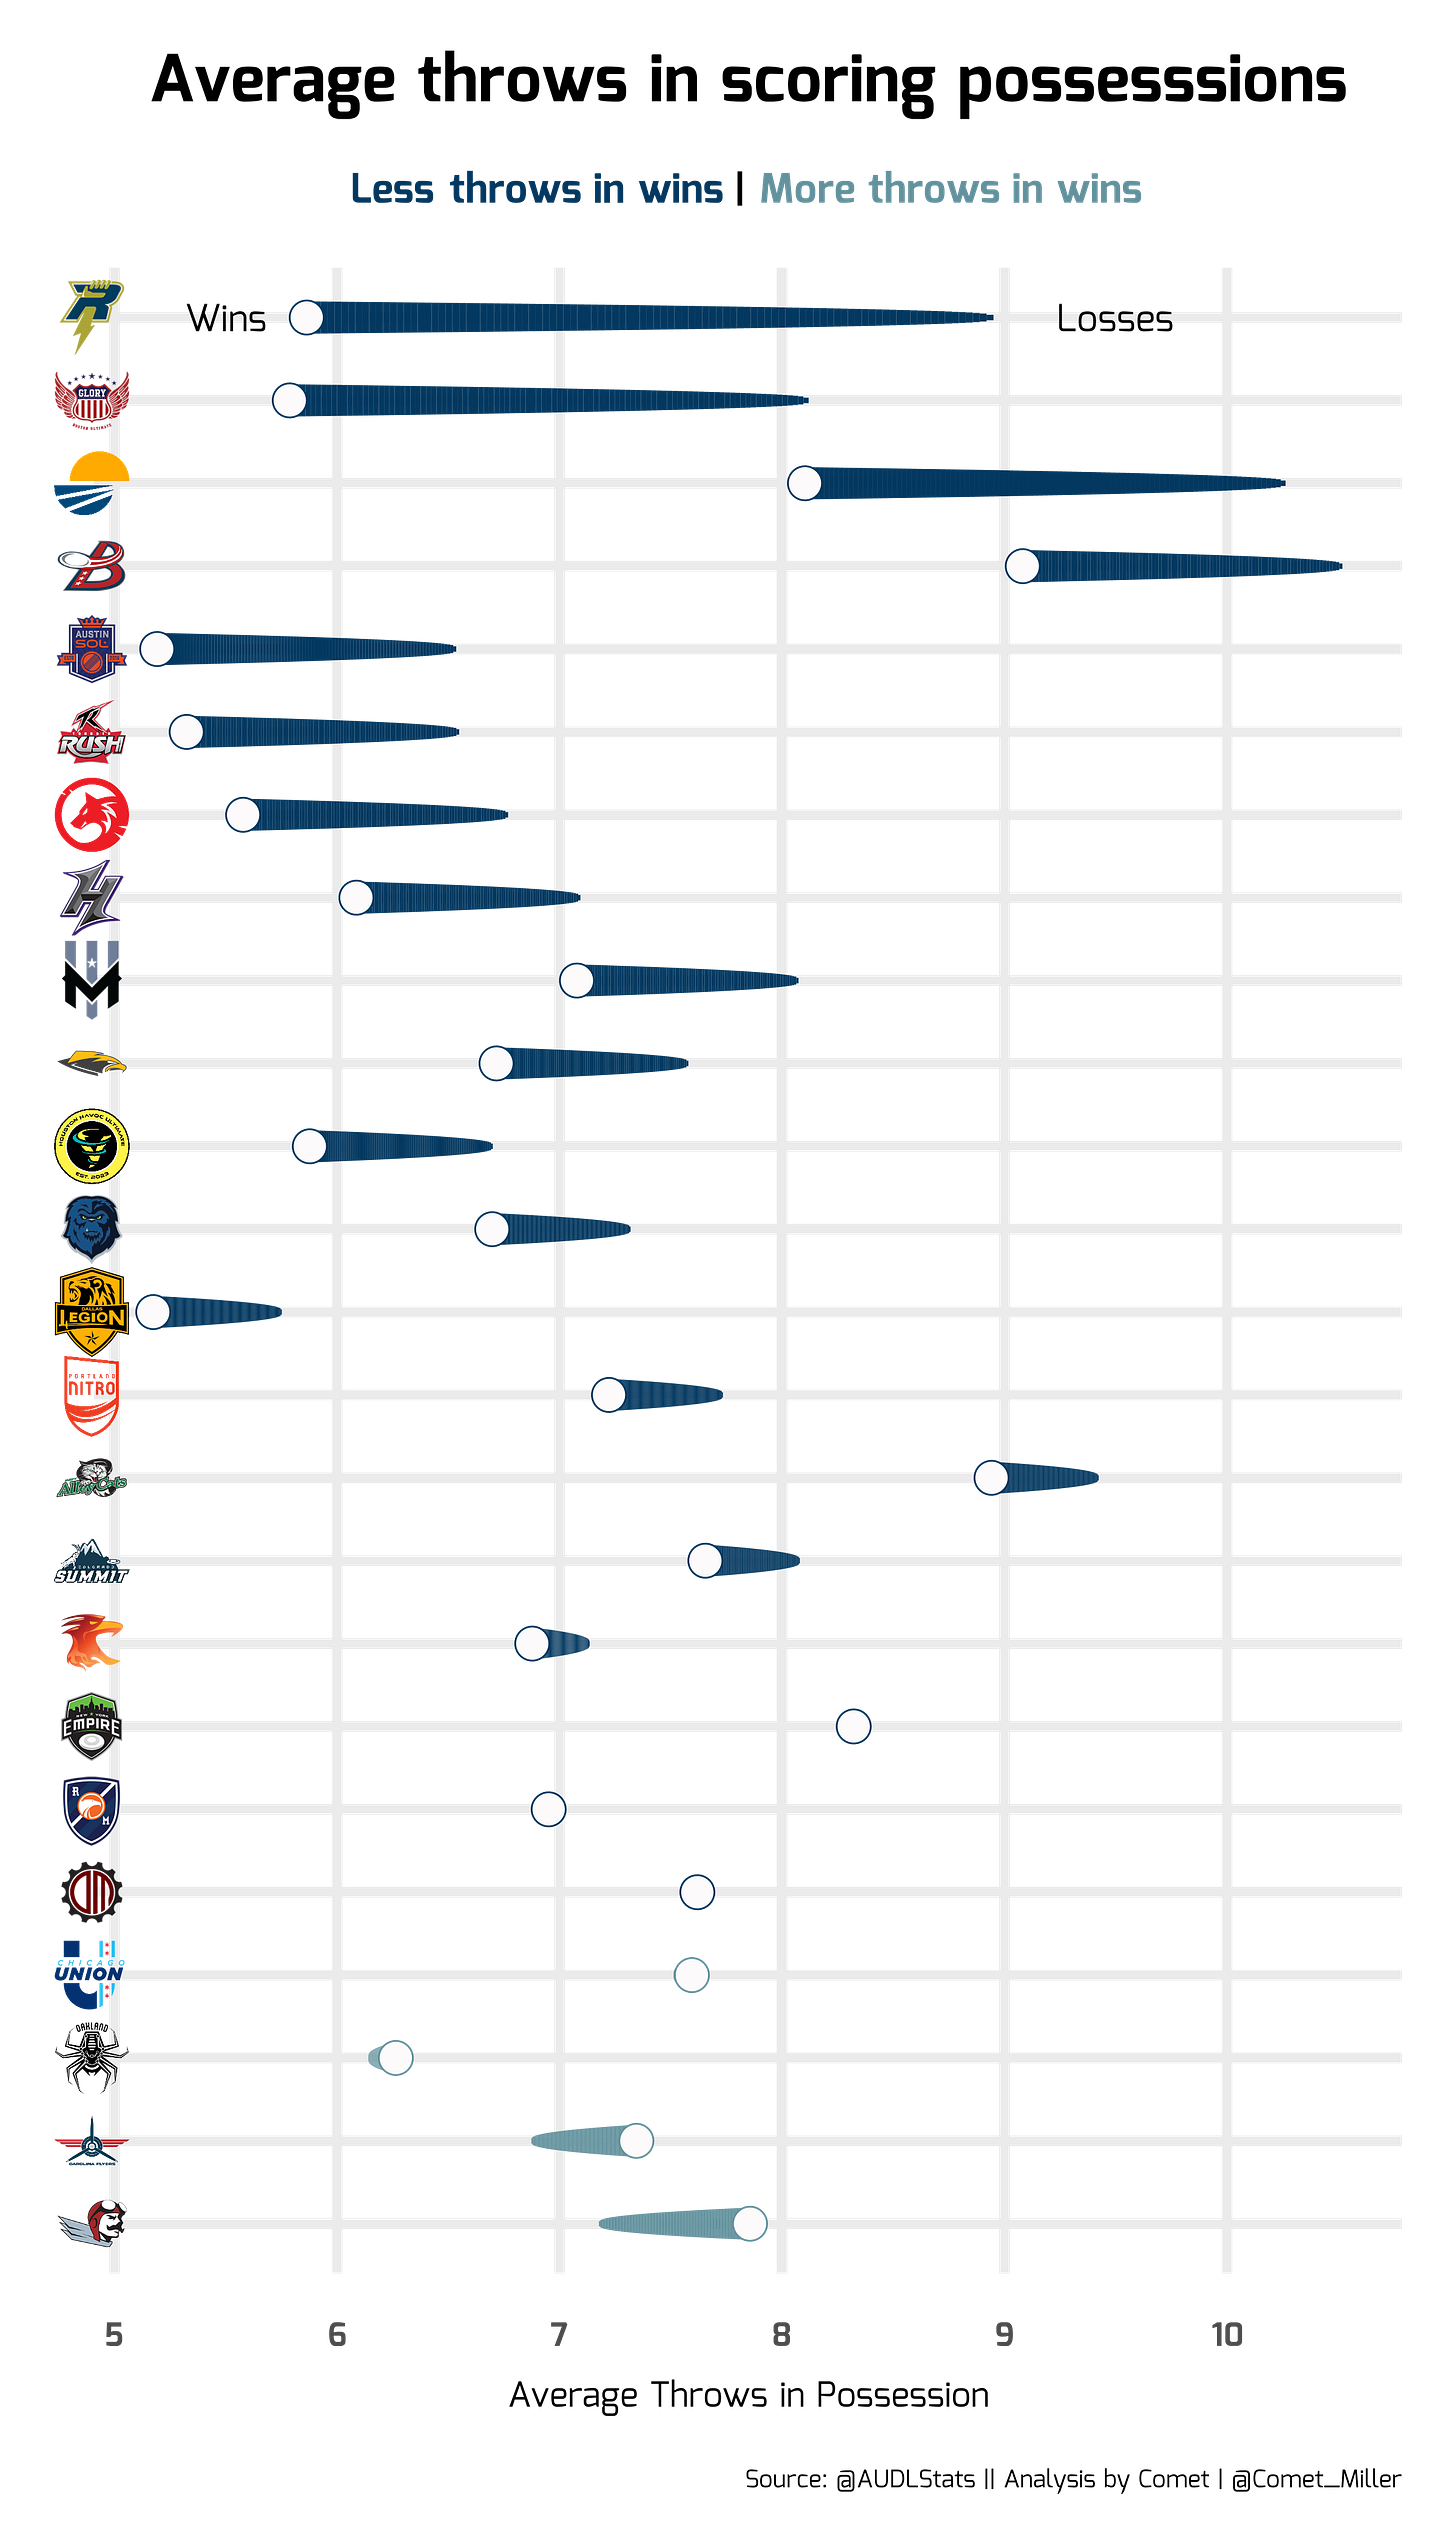
Another form of efficiency people might think about is the amount of throws it takes to score. Ultimate is a very nuanced sport and blanket statements about efficiency can be very difficult to make — any sort of claims usually depend on a lot of context. For example, I could talk myself into thinking that the best teams are able to score in very few throws and their best games reflect that. But, I could also convince myself that the most patient teams are the most deadly as well because they're more willing to keep possession and reset than take shots downfield that might be unsuccessful. The comet plot below shows each team's throwing average separated by wins and losses. The head of the comet is the number of throws per scoring possession, on average, a team has had during wins in 2023, and the tail of the comet is the number of throws per scoring possession a team has had during losses.
Most teams, on average, complete less passes on scoring possessions during their wins. However, LA and Carolina actually complete more throws per scoring possession on games they win. I don't know if there are any strong conclusions to make based off of that, but it is interesting to think about given those teams’ play styles and player personnel.
Vertical Offensive Scoring Efficiency Allowed
Let's jump back to the Vertical Offensive Scoring Efficiency for one last look. Upon reflection of the stat, it might make more sense to look at how each team affects the Vertical Offensive Scoring Efficiency of the teams they are playing against. Do good teams do a better job at making their opponent be "less efficient" (have a higher Vertical Offensive Scoring Efficiency)? Below is another bullet chart, but this time it shows each team's allowed Vertical Offensive Scoring Efficiency.
Again, the chart is ordered from highest to lowest on the left moving to the right. Madison, notably higher than the rest, forces teams to be significantly less efficient on their scoring drives. This sounds about right given that the Radicals are known for their zone defense. On the other end of the spectrum, it looks like Houston does a terrible job of forcing their opponents backwards. On scoring drives, Houston's opponents are moving that disc right up the field.
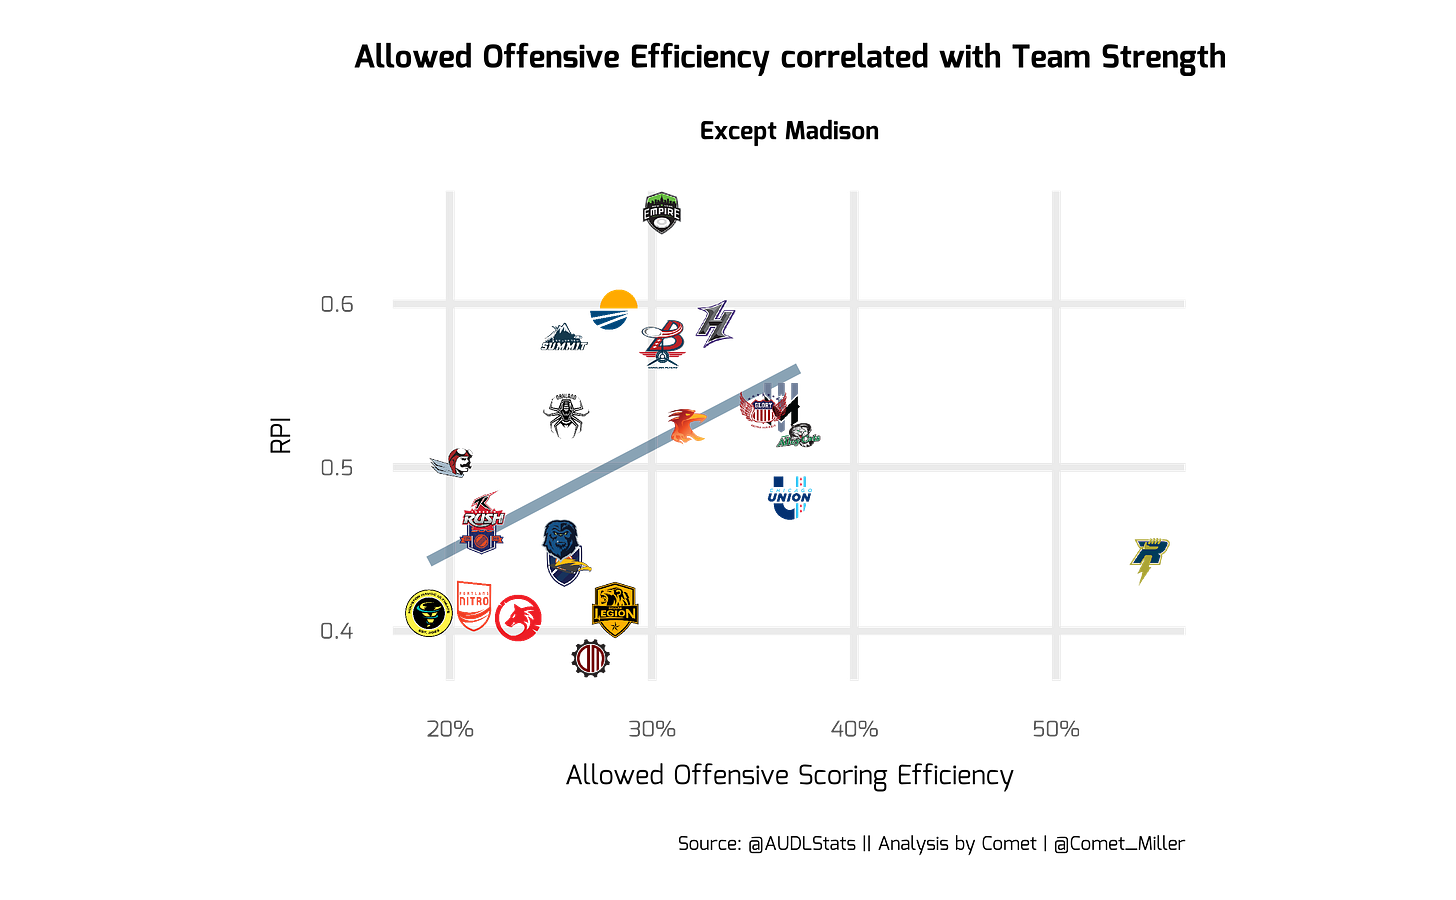
This is great, but is a team's defense when they get scored on at all indicative of how good they are?? I would pose that it is. Below is a graph of the average Allowed Vertical Offensive Scoring Efficiency plotted against RPI (a team strength metric discussed a couple of posts ago).
Minus Madison (who is an massive outlier), there is a strong trend showing that higher Allowed Offensive Scoring Efficiency actually correlates with stronger teams. In other words, even on scoring drives, a team's ability to force their opponent to gain a lot of absolute yards might indicate a high quality team.
Conclusion
As I wrap this up, I admit that the metric I'm proposing is a little counter-intuitive and there certainly could be a better way to express it colloquially. Does it really make sense that a higher number means the team is less efficient and a lower number (close to zero) means a team is highly efficient in getting to the endzone by way of vertical yardage? Maybe not, but hopefully after thinking about it for a second, it starts to make sense.
As always, feel free to leave comments or suggestions on better names or ways to go about explaining it.
Champ Weekend Model update
I've said it before, but one thing I like about this model is that it's solely concerned with how a team is playing and not at all about what their actual record is.
This week, even though the Union both beat out the Radicals and the Thunderbirds to a playoff spot, the model still thinks Chicago has a worse shot at making Championship Weekend! It's preposterous because it's impossible that that's the case, but it shows how poorly the model thinks Chicago is performing, which I think is quite interesting.
감사합니다
What's your preferred style of ultimate (either to play or to watch) in terms of Vertical Offensive Scoring Efficiency?
Thanks to @AUDLStats for the data. You can find me on Twitter @Comet_Miller. Thanks for reading!
— 밀혜성


