
First Round Playoffs Preview
Via a look at 2023 stadiums and uncovering AUDL's home field advantage

One of the things that impacts the type of play and, frankly, watchability of Ultimate the most is undoubtedly the weather. Games with high winds can still be intense, but only psychos would prefer windy-style games to games with little to no wind.
It's no secret to avid viewers of the league that certain stadiums tend to get worse weather and/or consistent winds than others.
As a side note: there is a subtle line of thinking around the league that the teams in the West Division don't play any defense. That's possible, but is it more likely that it just seems that way because the stadiums in the West just have better weather and the better defense in the East is actually masked by the bad weather games? The most unfortunate part about opining like this is that we don't have weather data specific to each stadium in each game, so there's no way to prove one way or the other. The perfectly objective eye-test is going to have to inform that personal opinion for now.
While we wait for weather data to be tracked for each game, this week I wanted to look a little bit more into stadiums in the AUDL. However, while doing so I got distracted and ended up following a convenient rabbit hole into wondering about the AUDL's home field advantage in general and then wrapped up building a model to preview the first round playoff games.
Stadiums
To start, I just wanted to take a look at the current stadiums used this season in the AUDL. I used the Google Maps API to grab the latitude and longitude of each stadium and plotted each (because of the scale of the map, the exact latitude and longitude wasn't as interesting, so optimizing the search results of the API turned out to be a fun waste of time).
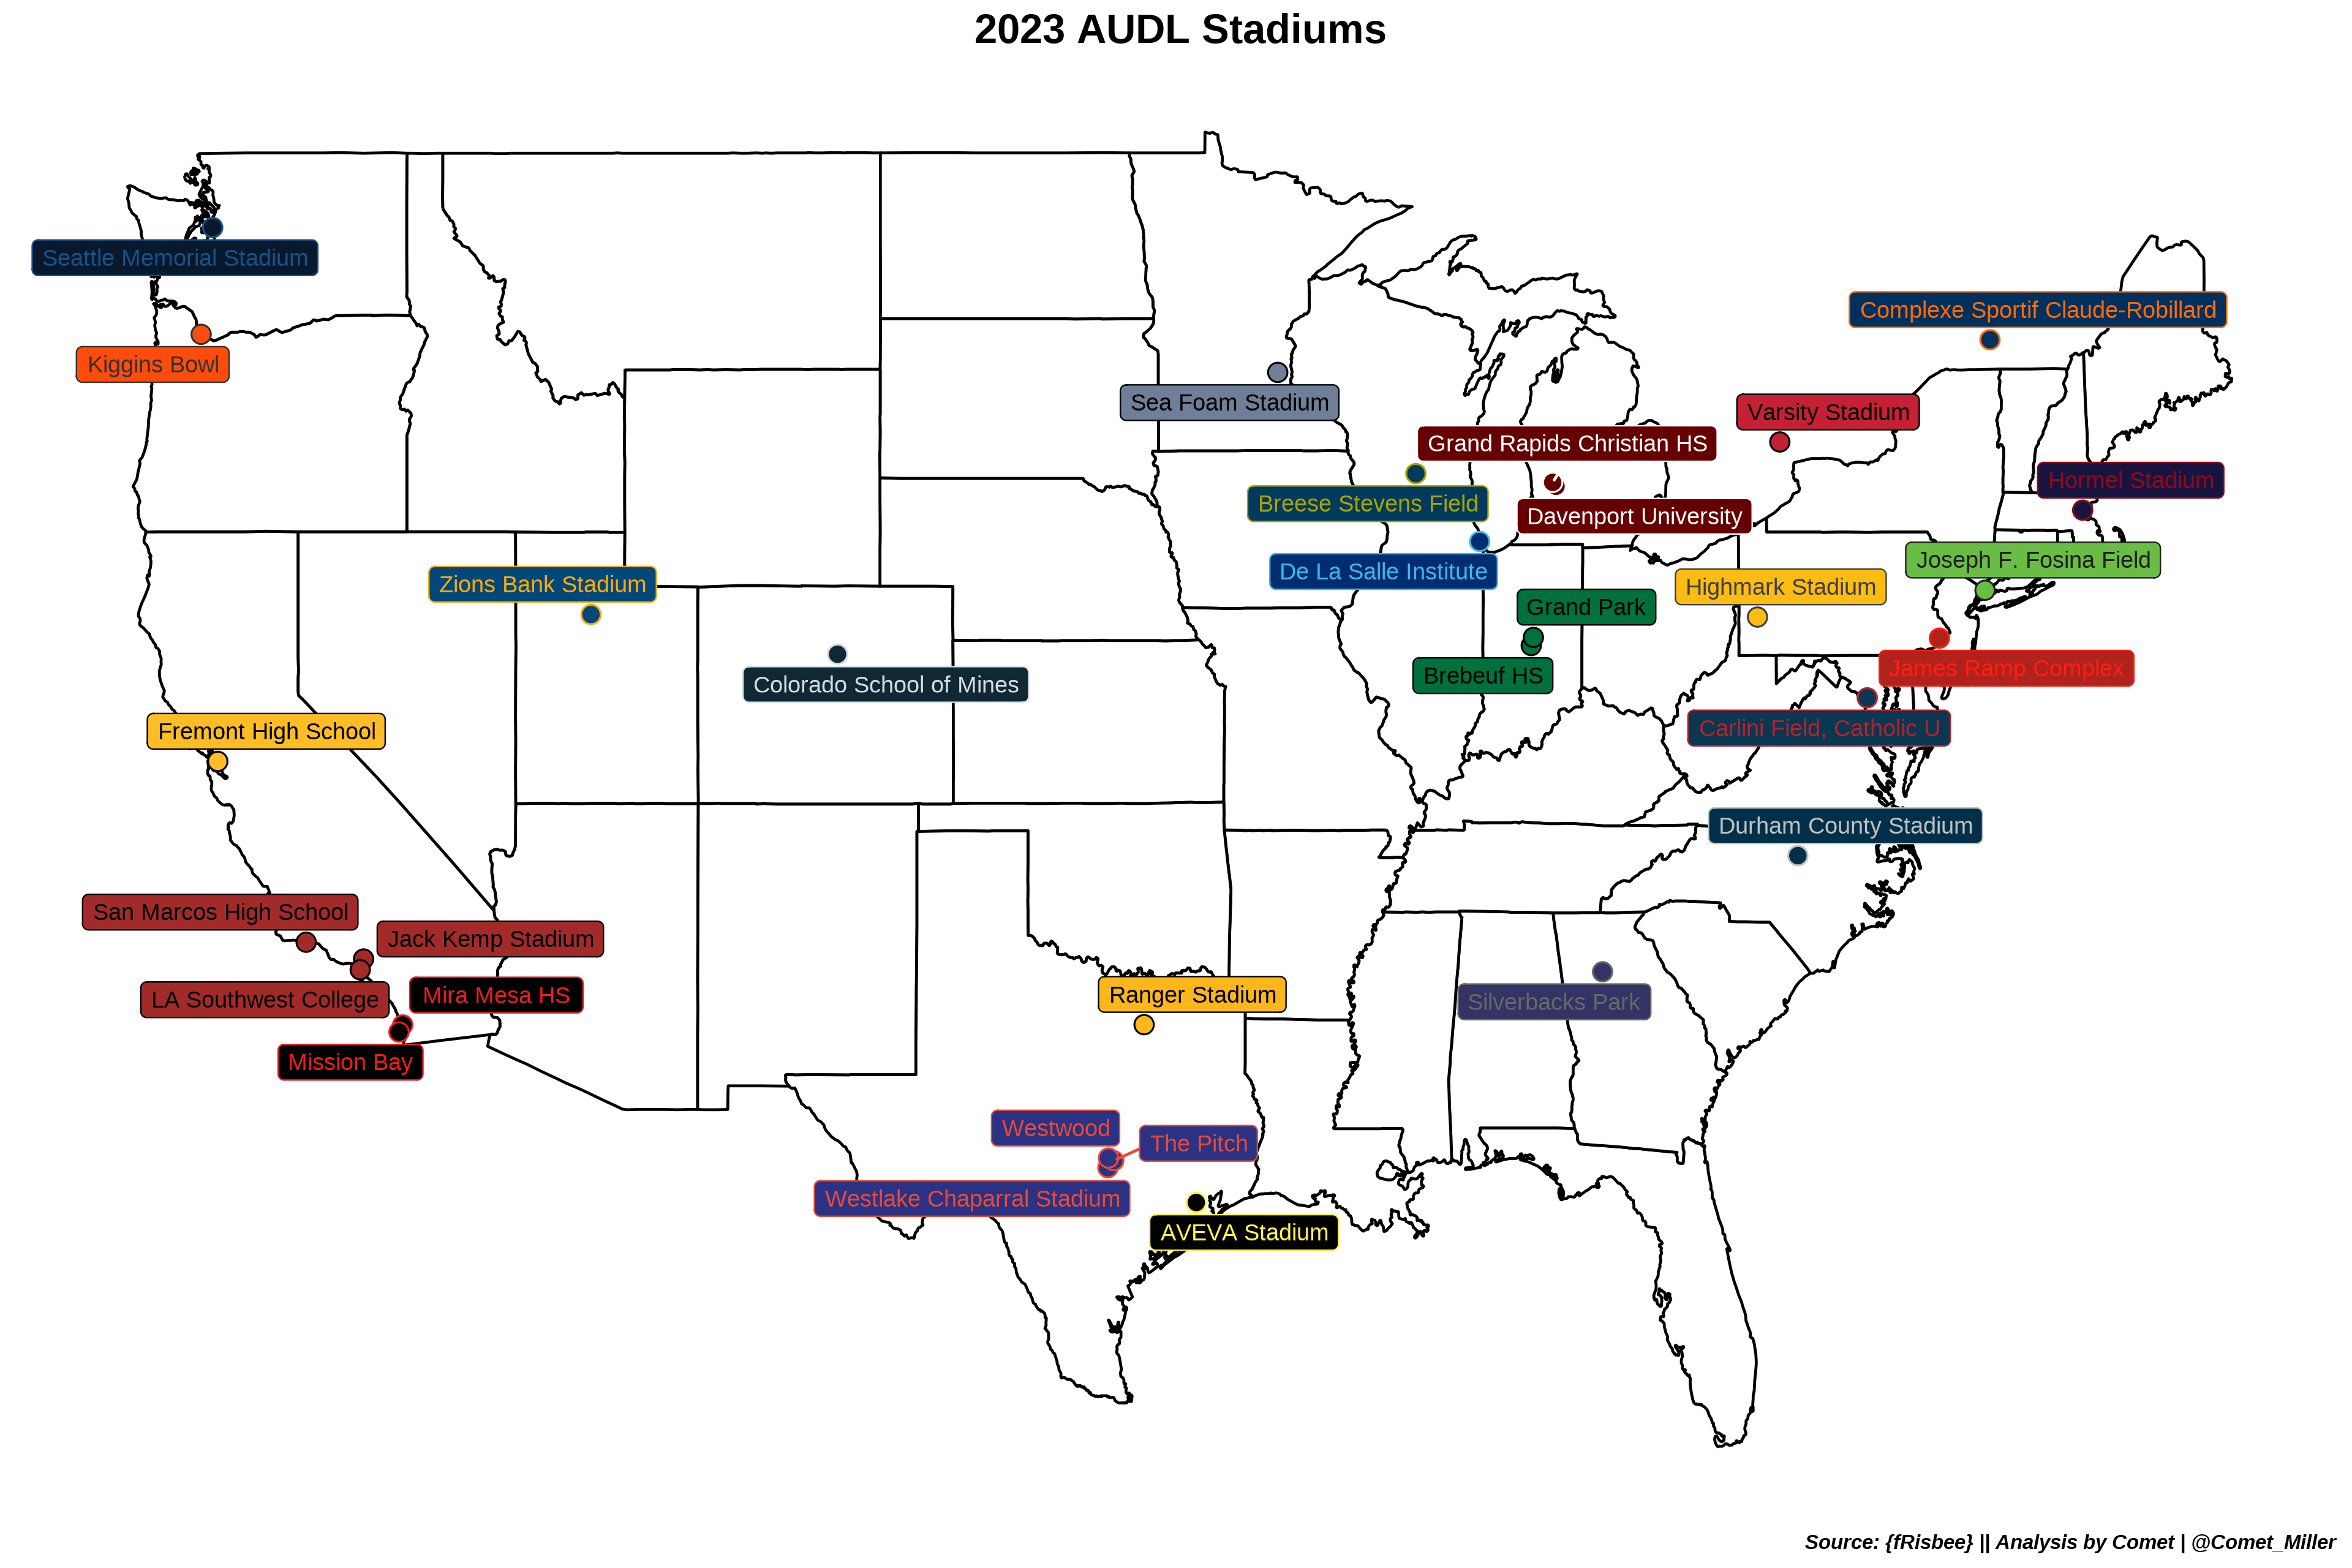
While nothing here is particularly exciting or insightful, it is interesting to note that LA, San Diego, Austin, Indianapolis, and Detroit all bounced around stadiums this year. It seems that a good sign of stability in a franchise is having a consistent place for your team and fan base to call home. But, it was fun to see LA head up to Santa Barbara the final game of their season given the amount of players on their team that call the college town home.
As alluded to previously, it's possible that the amount of points that are scored at a stadium might be just as, if not more, affected by the weather on game days as the quality of the teams or the defensive styles played. To visualize this, I collected all the results at stadiums used this season of the AUDL that had at least 3 games played there and calculated the total points scored for each game. The density plots below show the distribution of the total points scored at each of those stadiums in their respective histories in the AUDL.
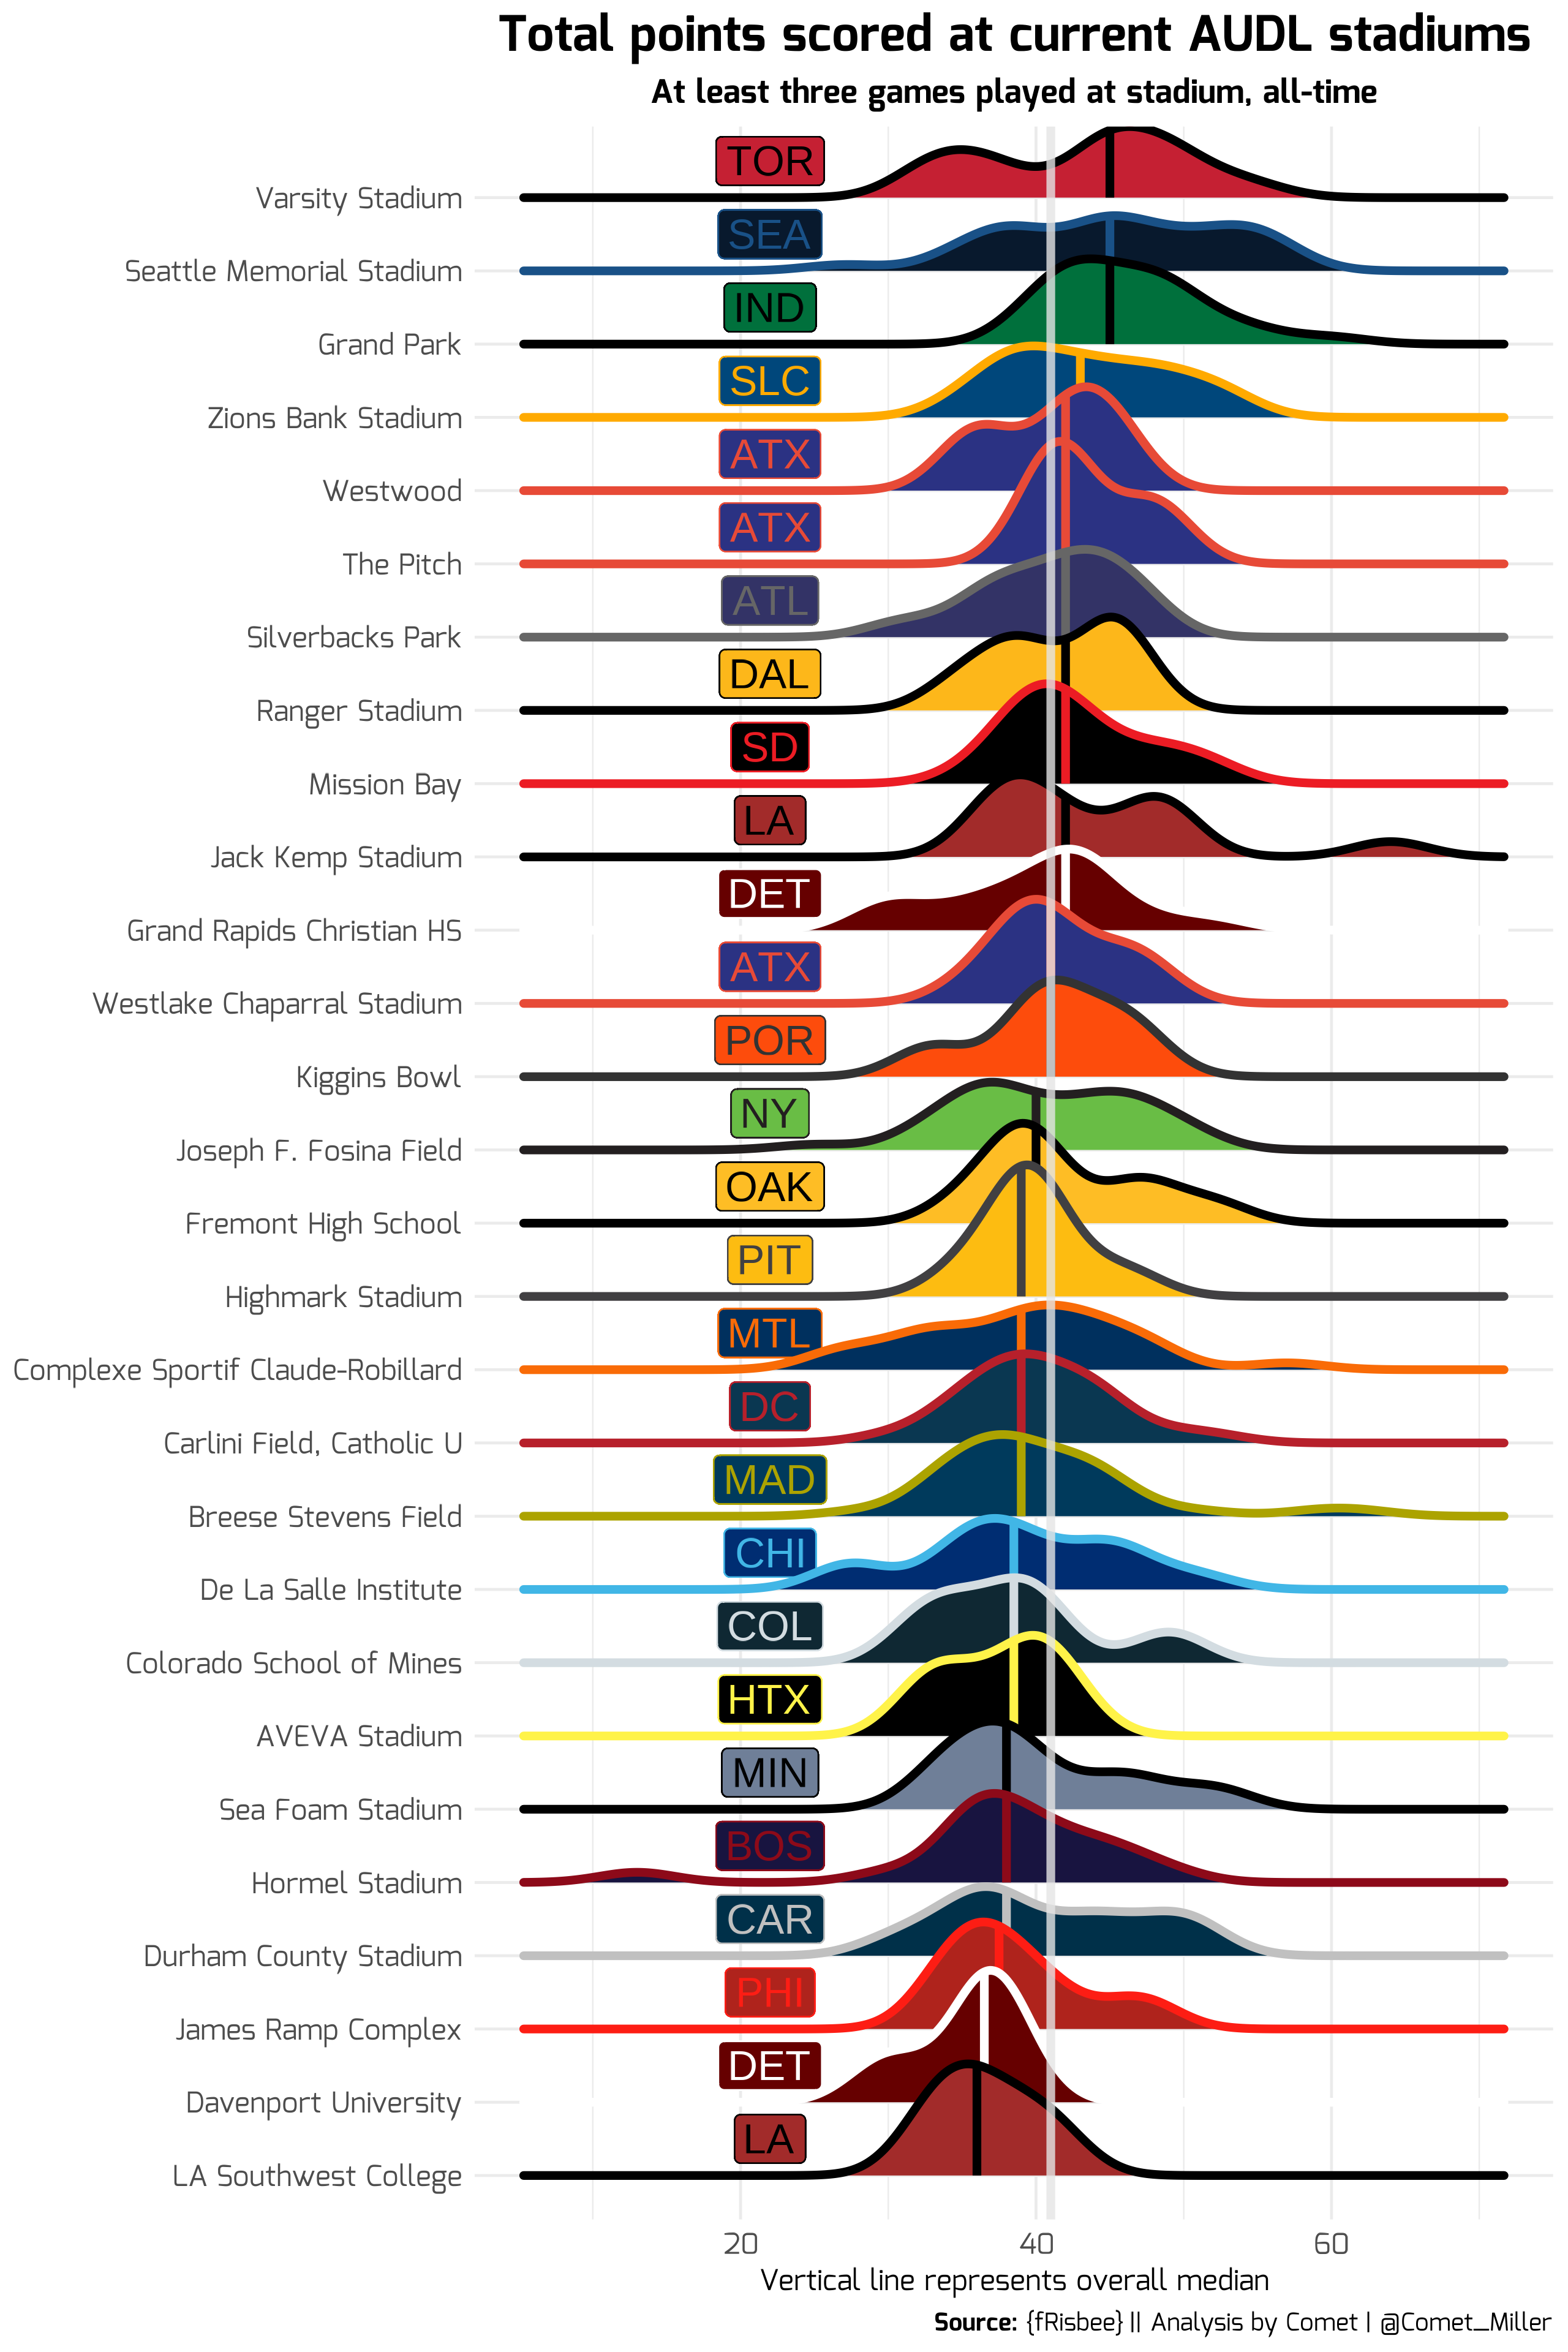
The plot is sorted by the stadium with the highest median total points scored down to the lowest median total points scored. Median points was decided to be less affected by outliers, though I think it could easily be argued that the outliers should be allowed to affect the ordering of the plot more since an extremely bad game affects the overall impression of what that stadium's weather is like. In the end though, using the median gives each stadium the benefit of the doubt.
Seeing LA Southwest College at the bottom makes sense because the games I've watched at that venue seem very swirly and sloppy. Again, there might be more to it than just weather, but it seems like a strong indicator. On the other hand, it's no surprise to see Grand Park near the top since it's the only indoor stadium currently in use and never has any wind, so we often see some of the highest scoring affairs there. More interesting, though, is the obvious bimodal distribution of Varsity Stadium in Toronto. It seems to say that most of the time the weather is fine, but a good chunk of the time they have more wind than is normal.
Home field advantage
Getting this far got my mind off track of where I thought I was going to go originally. I just had to know what the overall home field advantage was in the AUDL, if anything. But in order to calculate the home field advantage, we need to account for how good each team is and what the expected scoring outcome is in each game.
In order to do this, I modeled the score differential using a Bayesian regression model. Taking into account the RPI team strength metric for each team in the model as well as an indicator for whether or not the team of interest is home allowed me to fit a simple yet robust model. Similarly to my first post "The Chase for Championship Weekend", the model details aren't really necessary here, but the interested reader can feel free to reach out for more information regrading model fit, priors, sampling model, or other specification details if desired.
The model results related to the team strength was unsurprising. The difference in team RPI was extremely important in determining the final score differential for each game. And, additionally, the home field advantage variable was also extremely important! So, in case you've always been wondering (and specifically for the 2023 season), the home field advantage is just over 2 points (2.25 points on average to be exact; 95% credible interval between 1.3 and 3.2). For reference, NFL home field advantage is currently at around 1.7 points, and NBA home court advantage in between 3 and 5 points depending on the source.
This is interesting because 2 points is a big enough swing that it could definitely change the outcome of a game given two relatively closely ranked teams.
Now, with a model that predicts (quite well, actually) score differentials for each game, we are in a nice position to get some predictions for the first round of the playoffs.
On the left half of the table below we can see each matchup along with the compared RPI and Strength of Schedule rankings in the league. Higher RPI ranking indicates a better team based on the RPI metric, while a higher SoS ranking indicates a more difficult schedule this season.
On the right half of the table we can see the results from the model. All the details for each game are from the perspective of the home team.

It is a bummer that none of the games are supposed to be that close (hopefully this is proved wrong!).
Let's break down the first game on the list. According to the model, the Summit have an 87% chance to beat the Aviators, the highest win probability of the first round games. The expected score differential is +5 in Colorado's favor, and, if we want to put an interval around that, the model predicts that there is a 90% chance the final score is somewhere in between -2 and +12 relative to Colorado. So, there is a chance LA wins, but it's not likely.
It's no secret that the Flyers are expected to beat the Sol even though they're on the road. Austin has been blasted all year for not being as good as their record shows since they spent a vast majority of their season beating up on the bottom dwellers. In fact, even though they're away, the model predicts that Carolina has an 84% chance of beating Austin.
Conclusion
Carolina's advantage on the road was so surprising, for fun I also predicted what the model would think if Austin had to travel to Carolina for the playoff game instead. At home, the model predicts the Flyers would have a 94% chance of beating the Sol, up 10% from what they have this week. Additionally, the model thinks the Flyers would win by around 6 goals.
We'll see how the model's predictions hold up this weekend.
End of regular season Champ Weekend update
All in all, without knowing the records of each team, the model has done pretty well at predicting who the favorites are for making Championship Weekend.

The model still really doesn't like Chicago, quite ironically placing them below two teams completely booted from the playoffs.
Additionally, DC's chances went up this week. Finally, the Champ Weekend model actually likes Austin more than Carolina! We'll see which of the two models gets that one more right.
감사합니다
How many of the winners of the first round are going to be correct according to the model?
Thanks as always to @AUDLStats for the data. Additionally, in this post I utilized the {fRisbee} package in R quite a bit, so thank you to the maintainers. I'm also on Twitter @Comet_Miller.
— 밀혜성
Does your model for the Alleycats use their outdoor stadium in your projected +/-? I feel like I comment every week, but this is all really interesting and well-thought out. If we are adding to the weather data wishlist, I would hypothesize that player availabilities are also more favorable for home games. My mind wanders to 538's raptor modeling for basketball that calculates player contributions in expected wins, albeit I would hope availability is better for the playoff race. Unsure if your previous posts about roster consistency could split conditionally to Home/Away and what a correlation like that looks like or how it would affect your modelling, but it is certainly fun to wonder without doing any of the heavy lifting haha. Thanks again for the post!!