
Lineups
Parsing efficiency of personnel groupings and individuals

It’s finally here! The Chase for Championship Weekend has come to a close and we have our four teams that punched their tickets. It’s only appropriate that we revisit, briefly, the predictions that the model I introduced in my first post. Since Week 8 (the first week I introduced the model), three of the teams with the highest probability in their divisions made Championship Weekend: New York, Salt Lake, and Minnesota. However, and probably to everyone's surprise, Austin only had an 8% chance to make it back then. Even in the most recent post, the Sol had less than an 8% chance to make it all the way to the final four. However, at that point, the model liked Indianapolis slightly more than it liked Minnesota.
In retrospect, I think the average fan would conclude that the results make sense. Austin was truly a shocker and Minnesota over Indianapolis surely wasn't a forgone conclusion, while New York and Salt Lake felt like big favorites.
Today I explore some of the most used lineups in the AUDL and focus in on parsing the data in a different way than you might naturally find on the AUDL's stats website.
Divisional Finals lineups: will it translate?
In the spirit of focusing in on the Championship Weekend teams, I was curious about the lineups that each team used in their divisional final. Did their most used O line or D line play together a lot throughout the season? Or was each line's personnel groupings something that gained gradually increasing consistency over the course of the season?
What I found was quite surprising:

The above plot shows the number of points played the most used O line grouping played together throughout the season. The most recent data point in each plot represents the divisional championship games.
For both the Wind Chill and the Empire, the most used O line in the divisional championship game had not played together at all previously. I wasn't aware of this being the case for Minnesota, but surely this would have looked much different for the Empire if they weren't missing Jeff Babbitt and John Lithio.
On the other hand, the most used Shred O line grouping did play together throughout the season, but also didn't play together at all during 7 of their games.
One would think O lines would be more consistent than D lines given the amount of players that typically play D line on a given game day roster.
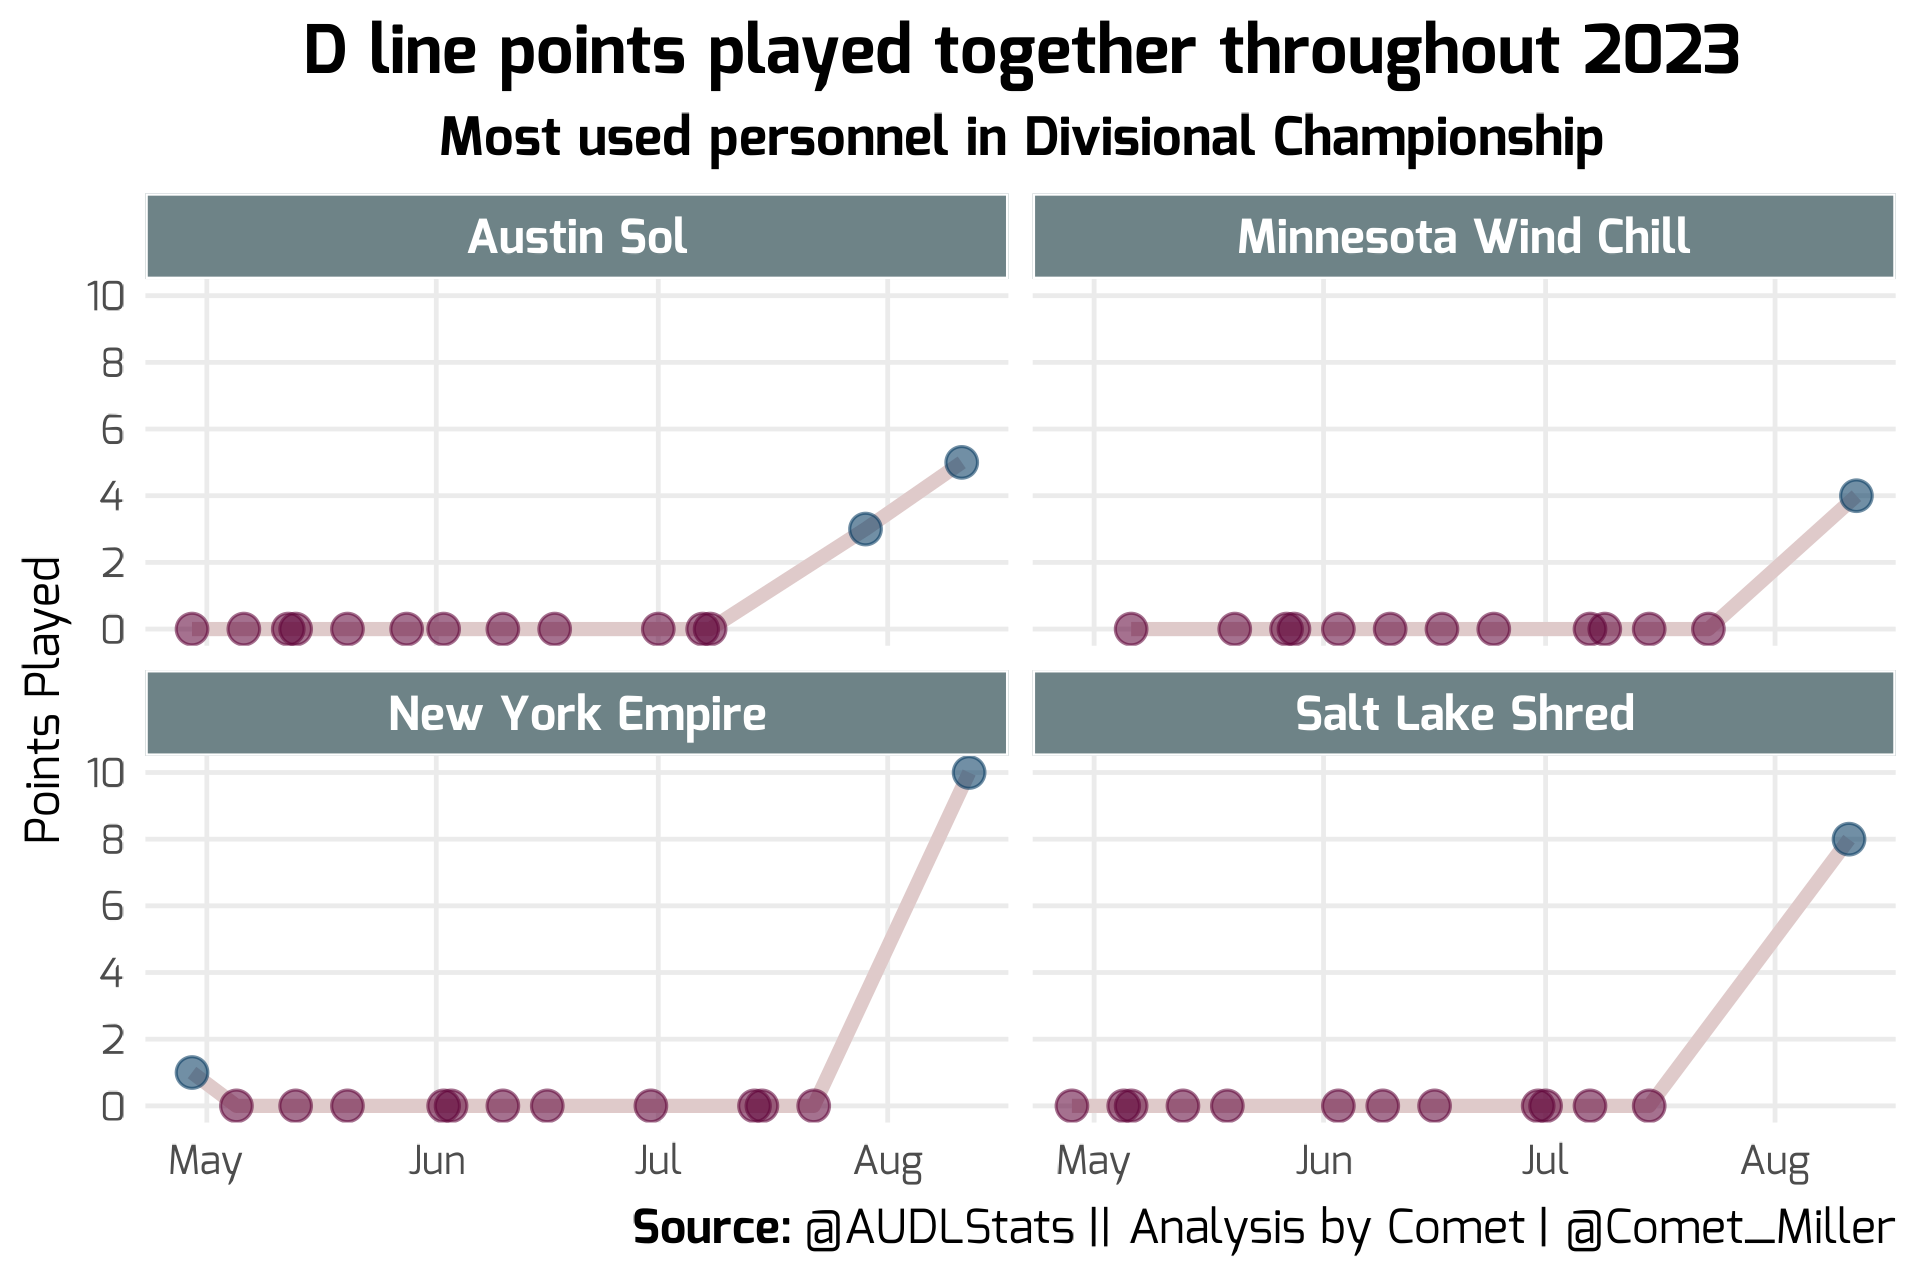
Seeing this was even more shocking! The most used D line grouping from the divisional championship games for each team hardly (if ever) played together in the regular season.
What does this mean, if anything, about the process of the regular season compared to the playoffs for these Championship Weekend teams? Is it just coincidence? Honestly, I'm not sure there's an obvious answer and maybe it's very team specific, but it was surprising to see.
Team efficiencies with filters and splits
Next, I wanted to take some of these personnel groupings and discover how teams used them throughout the season. First, I took out any end of quarter points because those can misrepresent a lot of typical ultimate situations. Next, I focused in on personnel groupings that played at least 10 points together throughout the season (this is a mostly arbitrary cutoff, but trust that there was some reason to it).
So, how efficient was each team given their most consistency used personnel groupings not including end of quarters? The below plot shows the hold percentages for each team. A point represents the hold percentage for a specific personnel grouping that had at least 10 points played together throughout the season. The bigger the point, the more points that personnel grouping played together (and, in turn, the more their hold percentage affects the overall hold percentage of the team).

The "X" in plot with the circle around it represents the aggregated hold percentage for the team given the described filters. The labeled percentages on the right are the values of the aggregated hold percentage for each team.
At the top we see the two top teams in the league by RPI rank and Adam Ruffner's rankings.
Next, we can look at the same plot, but for D lines and break percentage. The same filters and philosophies apply.
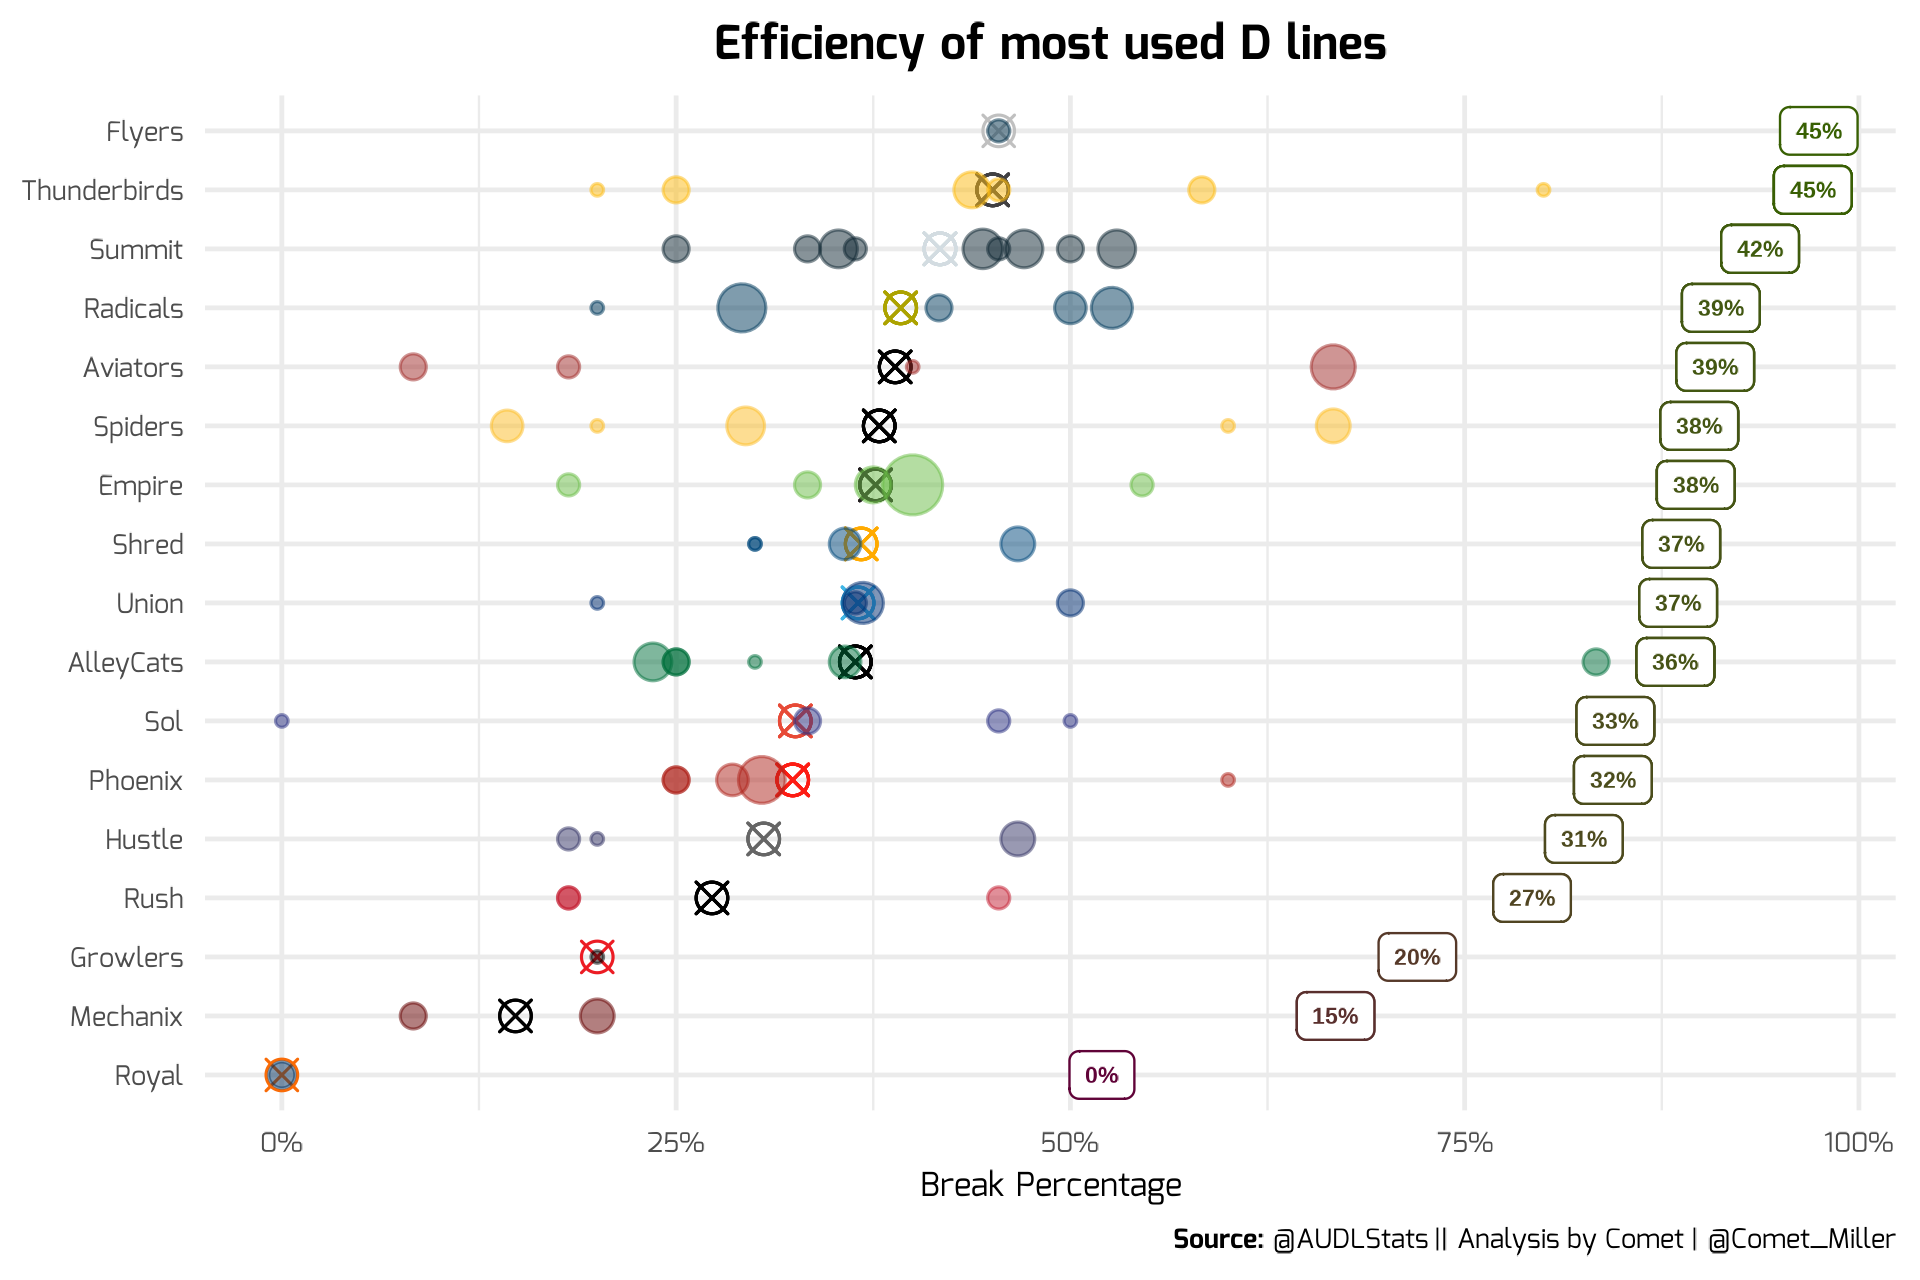
You'll maybe recognize that not every team is represented in the two plots above. That's because there are some teams that did not have a single personnel grouping play at least 10 points together over the course of the entire season!
Individuals and two way players
Lastly, let's see if there are individuals that deserve some additional praise for having success on their lines both on D points and on O points.
Below is a plot that shows players' individual hold percentages and break percentages. The only players on this plot were sufficiently "two way" players, meaning they played at least 3 points per game on D and O over the course of the season (again, this is mostly arbitrary, but as players have fewer and fewer data points, the insights become much more difficult to validate).
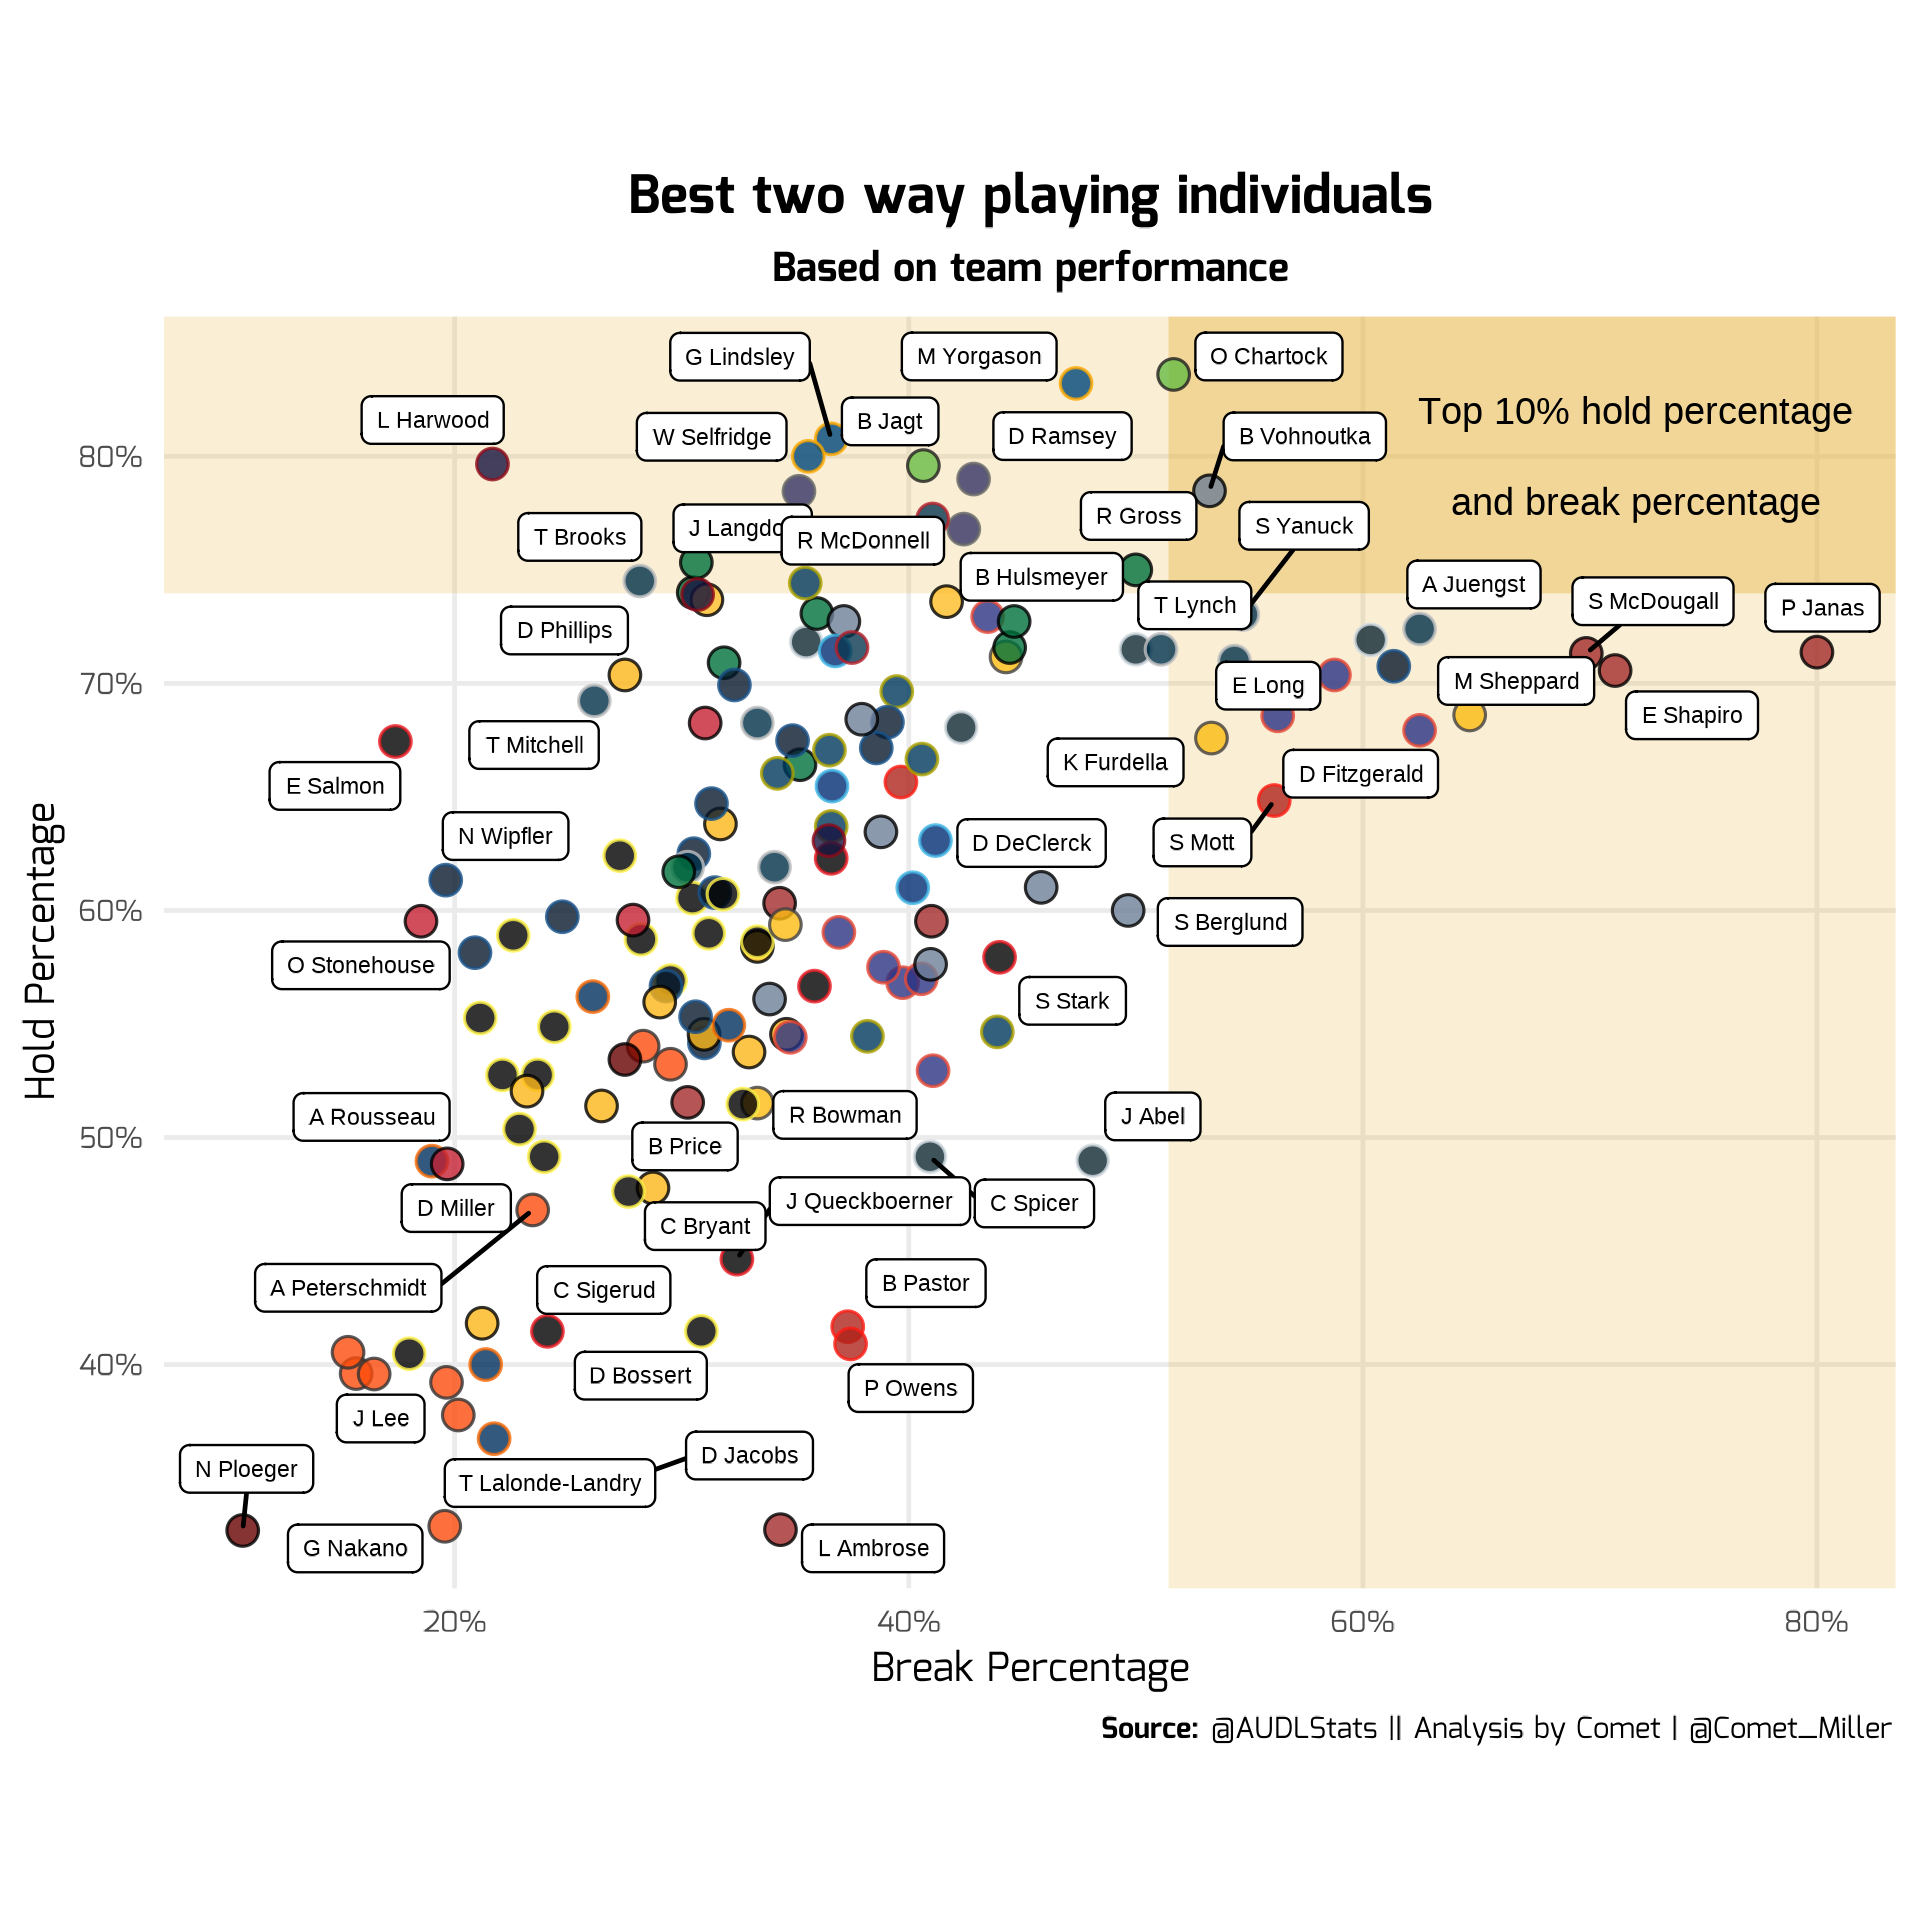
The gold bands represent the top 10% of break/hold percentages. Notably, Oliver Chartock of the Empire and Brian Vohnoutka of the Wind Chill are the only two individuals that are in the top 10% of both. You'll also notice three Aviators that play almost exclusively O points. Given that LA uses the vast majority of timeouts to substitute in their O line on break chances, those players qualified with enough "D line points" (not all teams use their timeouts to try and secure break chances with their O line).
Semis preview
Finally, here is the table that previews the semifinals using the same model I introduced for the playoffs to predict game winners and point differential.

Because of the unique nature of Championship Weekend with Minnesota being essentially a home team (not only will Minnesota surely have a home environment because of fans, but they also have held practices in the stadium), I applied the "home field advantage" that game despite the Shred being "home" due ot being the higher seed. For the Sol vs. Empire game, I did not apply the home field advantage to either team.
Again, I ask: can the Sol overcome the massive odds against them? A 2% chance is even smaller than any of their previous matchups. The Wind Chill vs. Shred game, on the other hand, is a much more intriguing matchup.
Maybe over the offseason I'll check it out, but I would be surprised if other Championship Weekend attendees in the past were as low ranked as 7 and 13 in terms of team strength.
A note on offseason programming
First of all, if you've read this post (or any of my posts this season) thank you! I will not be keeping up with the regular programming that I've done since starting to write some months ago. However, I do have some plans to get ahead and learn some things between now and the start of AUDL 2024. I would like to refine some of my models, dig more into the spatial data, and see if I can establish more "ground truths" that other sports have discovered in their analytics research.
As such, I will still put out some posts here and there, but as opposed to timely or currently relevant analyses, they will more reflect "grey papers". I have no intent on them being as rigorous or detailed as an academic/published paper, but definitely looking to be specific and exhaustive enough to thoroughly understand the topic at hand.
If you have any suggestions, feel free to reach out.
감사합니다
What do you think? How many of the favorites will win in the semifinals?
Thank you to @AUDLStats for the easily accessible information throughout the season. You can find me on Twitter @Comet_Miller now and during the offseason.
Again, I truly appreciate the kind words and feedback I’ve received during the past few months.
— 밀혜성