
Roster Consistency
Plus a quick Championship Weekend model update going into Week 9

Last season in the AUDL there were three expansion teams that joined the league, all in the West Division: Colorado Summit, Portland Nitro, and Salt Lake Shred. The preseason chatter included a lot of talk about the talent on each team and the ceiling that could be reached. Bryan Jones, former New York Empire head coach, stated definitively on Ultiworld's Stall Seven podcast that the best of the three teams was going to be the Portland Nitro, and, if I remember correctly, that they would be a legitimate championship contender in their first year as a franchise.
During the first few games of the 2022 season, Portland looked like they might be the team Bryan Jones suggested, including having multiple chances to win while taking the Colorado Summit to overtime. But fast forward a season and a half and Portland has turned into one of the worst teams in the league after racking up loss after loss for 14 months now. This season they haven't won a game and they haven't gotten particularly close besides their opening game versus the Shred. What happened to the team that a former championship coach so highly talked up? The obvious answer is that the best talent Portland signed hasn't consistently cleated up for them, especially after the first game or two of each season. But underneath that answer is an ugly reality about the Nitro’s roster commitment level and stability.
This anecdote leads into a unique challenge the AUDL and its teams has as a semi-pro league — most players aren't just playing ultimate full-time. This makes commitment levels on each team potentially variable depending on players and cultures throughout the league.
I don't think it's a question that if most AUDL teams were in a position to create valuable enough incentives in player contracts to have highly consistent practice and game attendance among their best players that competition levels among some of the more mediocre teams would drastically improve. However, that's just not where most teams are. Culture and individual player commitment are bigger factors in week-to-week reliability.
There's no doubt that continuity is better than disparity, but this brings up a question that we may be able to find answers to: which teams have the most consistency and does that correlate at all with success?
Roster depth
Let's begin with basic roster depth. In the AUDL, only 20 players that are signed to a team can be listed on the active roster and play in each game. Hypothetically, a team could sign just 20 of the best players they can find. However, for obvious reasons, teams sign more than 20 to fill out their practice roster and to have additional bodies in case of injury, to tinker with lineups, or allow for players to stand out and prove themselves throughout the season.
Some coaches, for one reason or another, dip further into their team for additional bodies on gameday than others. Below is a plot that shows how many total players each team has used so far this season beyond the baseline of 20 that would be minimum if a team never had any injuries or absences and never changed their lineup from their top 20 personnel.
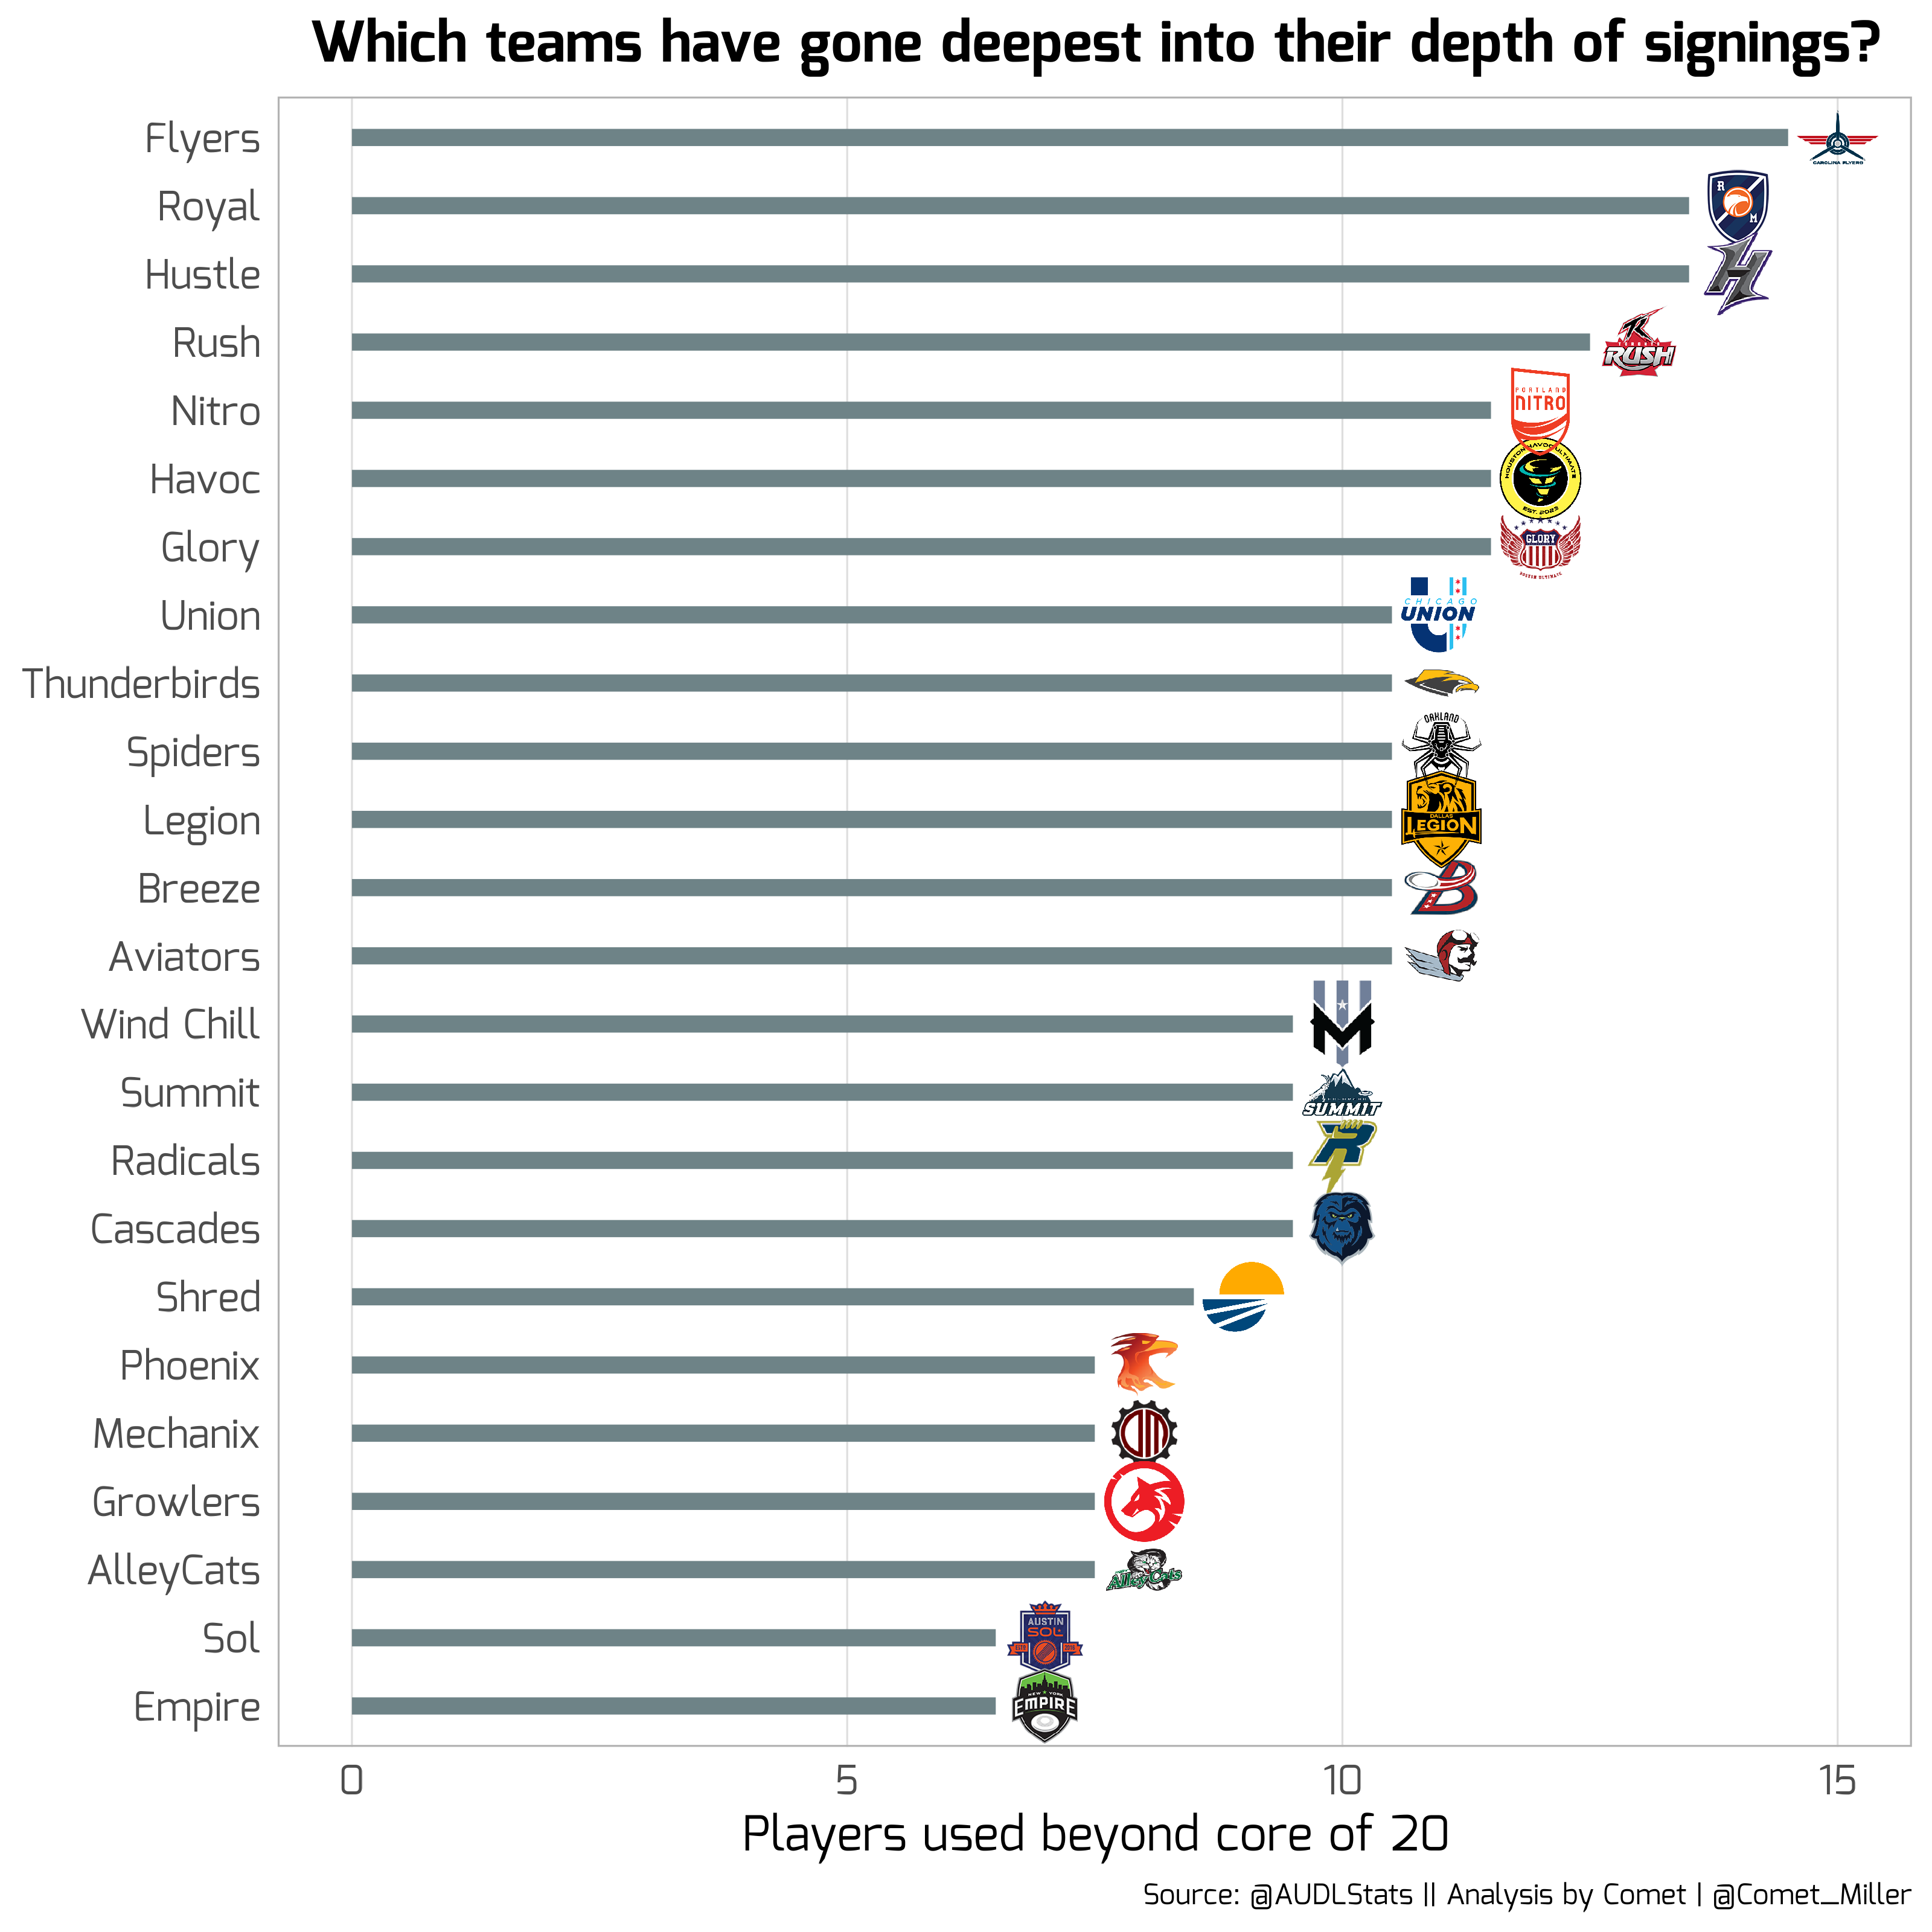
From the graph we can see that the Empire and Sol have only gone 27 deep into their signees, the least of any team in the league so far this year. Meanwhile, the Flyers have dipped 35 deep into their player pool.
One of the points this graph is missing, however, is what this means from one game to the next. Does this mean that the Flyers truly have a more inconsistent roster than the rest of the league?
Game to game consistency
Let's go a little deeper and see if we can draw some insights at a more granular level. The graph below shows the roster turnover for each game that has been played so far this season.
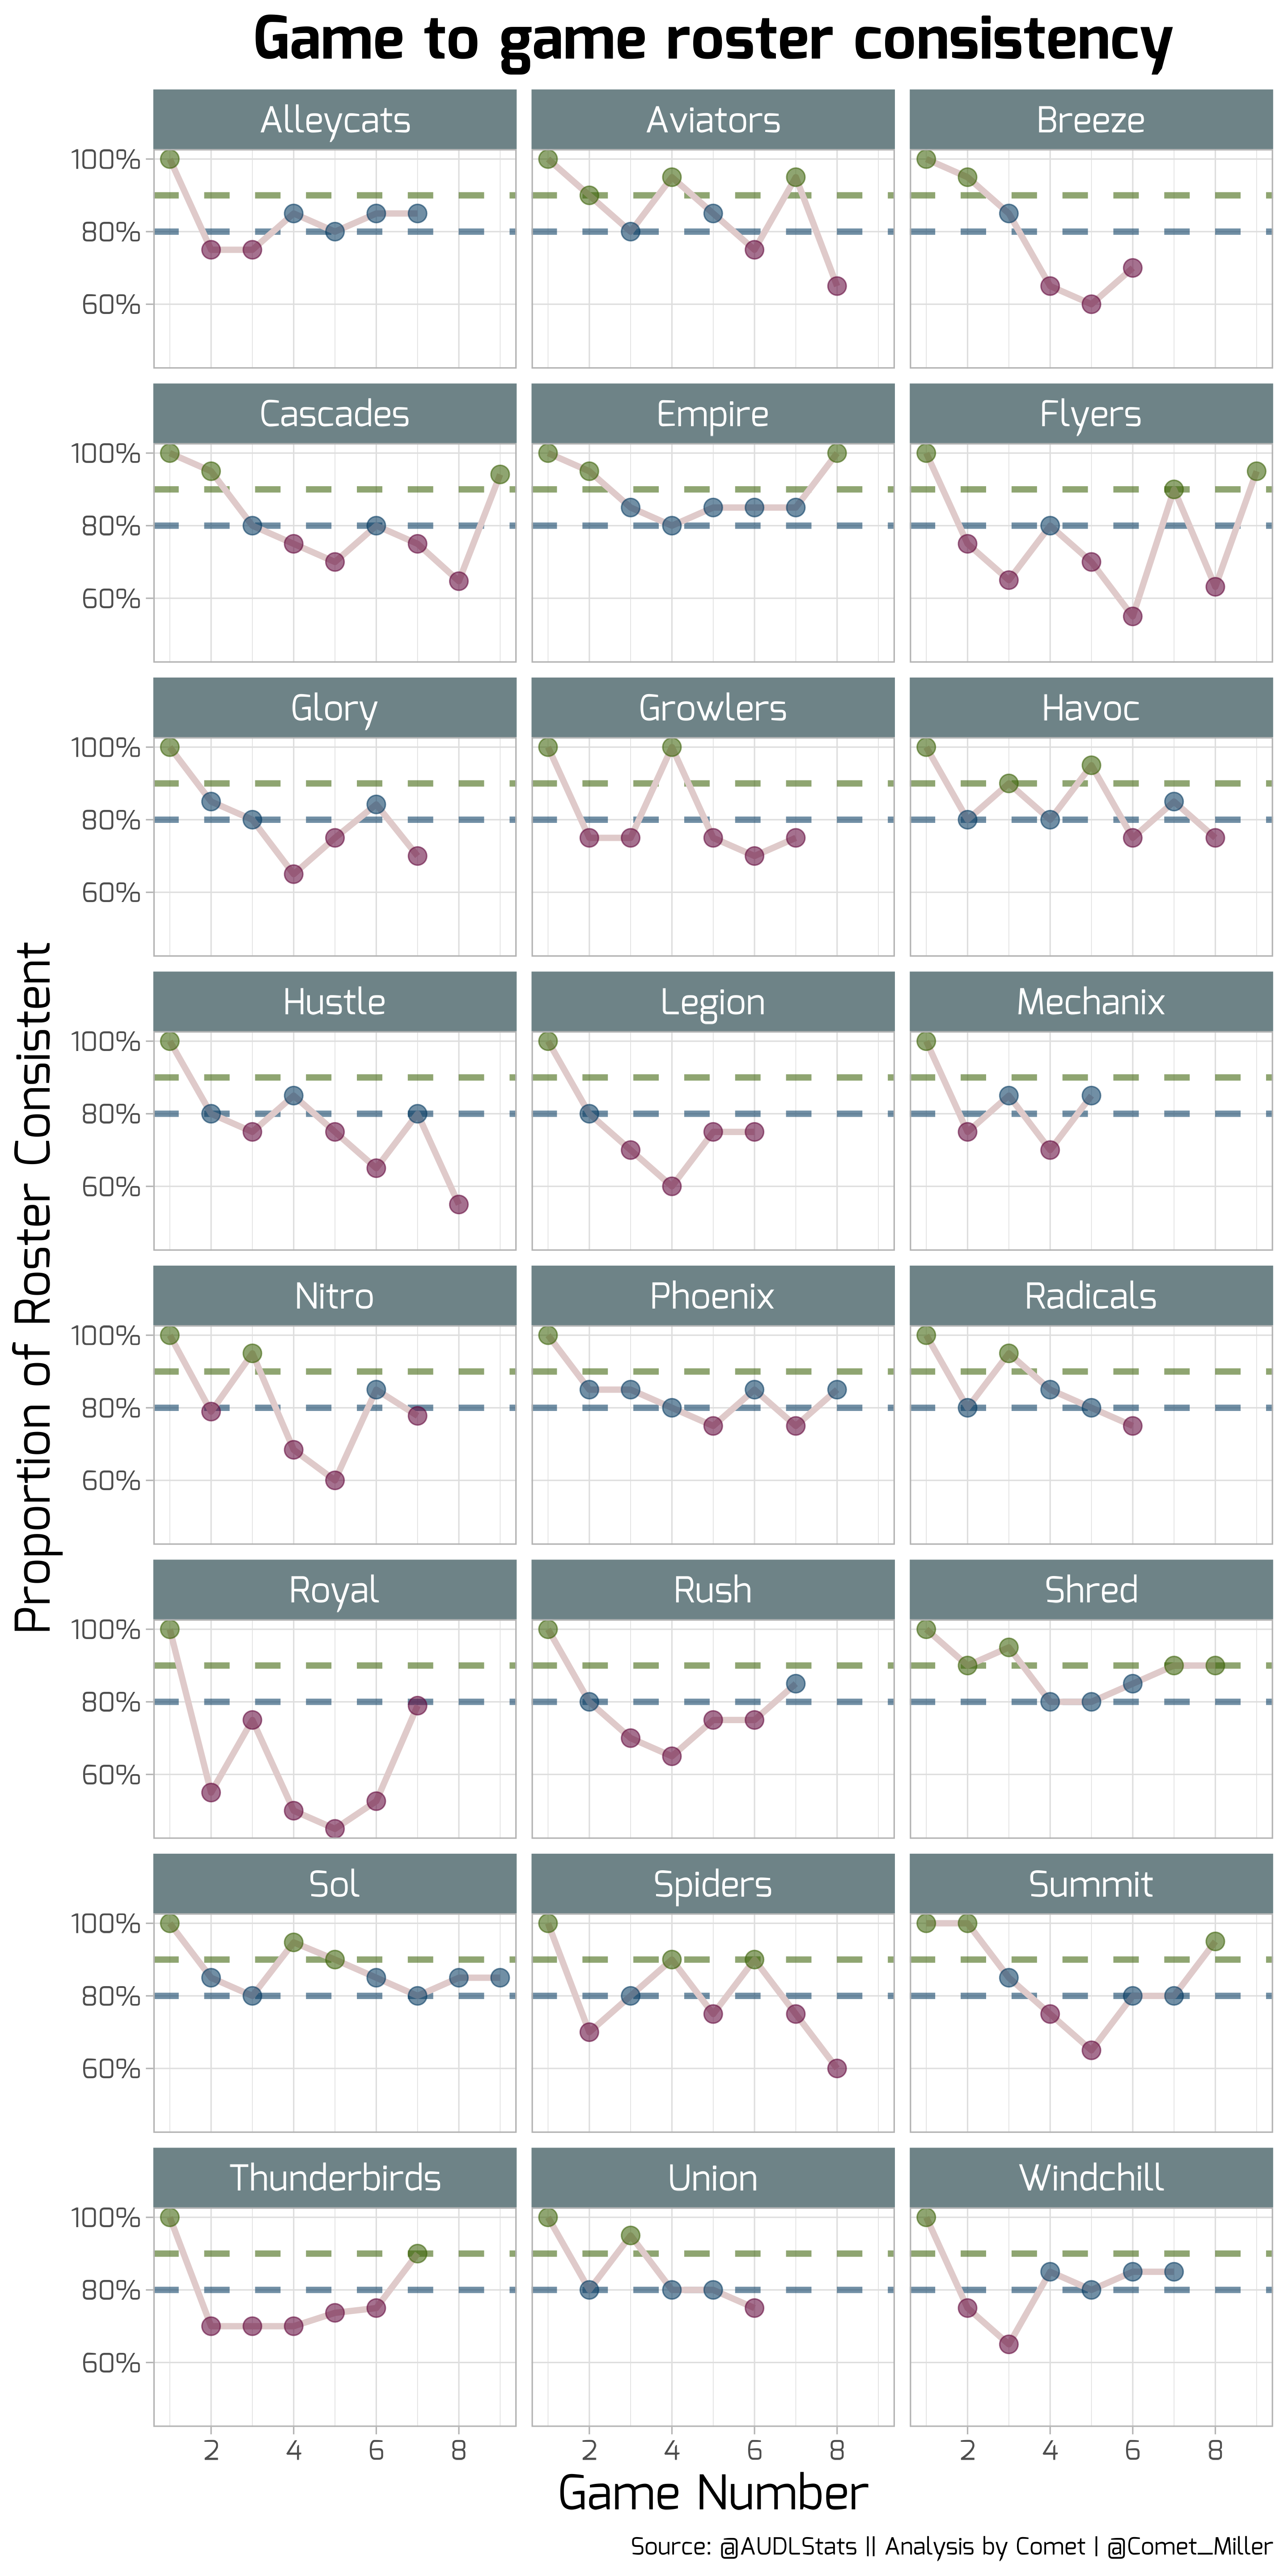
Let me give an example of what this plot is saying. Looking at the top left facet, we can see that the AlleyCats’ second game this season had a roster consistency of below 80%. Because each game day roster has 20 players on it, this means that the AlleyCats had more than 4 players missing from their second game that played in their first game. Further, because the third game of the season also had a roster consistency below 80%, this means that there was also significant roster turnover from game 2 to game 3.
While the color coding on the plot isn't meant to make a judgment statement on roster turnover thresholds, I arbitrarily chose 90% or above to be green, between 80% and 90% to be blue, and below 80% to be red since that means at least a quarter of the roster is being replaced since the previous game.
Some teams that stand out with high levels of roster turnover consistently are the Royal and the Thunderbirds, each with five games of under 80% roster consistency. On the other hand, the Empire and the Shred have never had a game yet this season with low roster consistency. Because it's hard to see all these plots at once and draw aggregate conclusions, below is a table that shows, in order, the average roster consistency from week to week for each team.
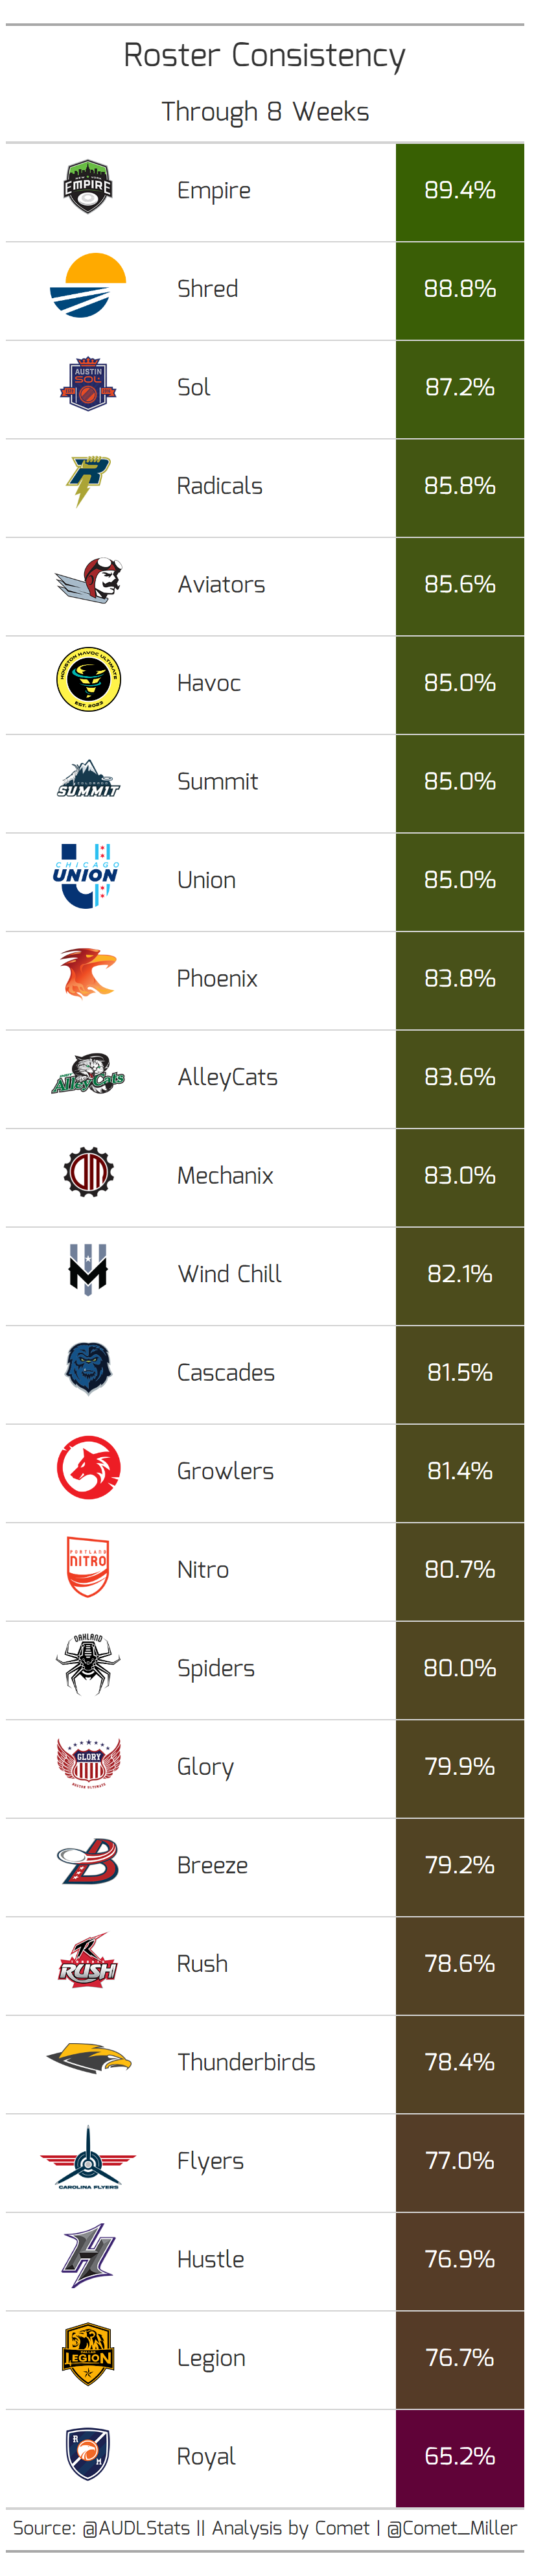
Again we see the Empire and the Shred at the top of the league with the most roster consistency and the Royal and Legion with the worst roster consistency on average. You'll also notice that Houston is actually in the top half of the AUDL in roster consistency even though they've gone 32 deep into their player pool, so the roster depth plot and the roster consistencies are saying two related but different things.
Concluding thoughts
What the previous analysis hasn't done is make any value judgments on each team based on their roster consistency. The Roster Consistency table above has both good teams with high roster turnover and bad teams with relatively consistent rosters. The plot below shows the relative position of teams with roster consistency on the y axis and current win percentage on the x axis.
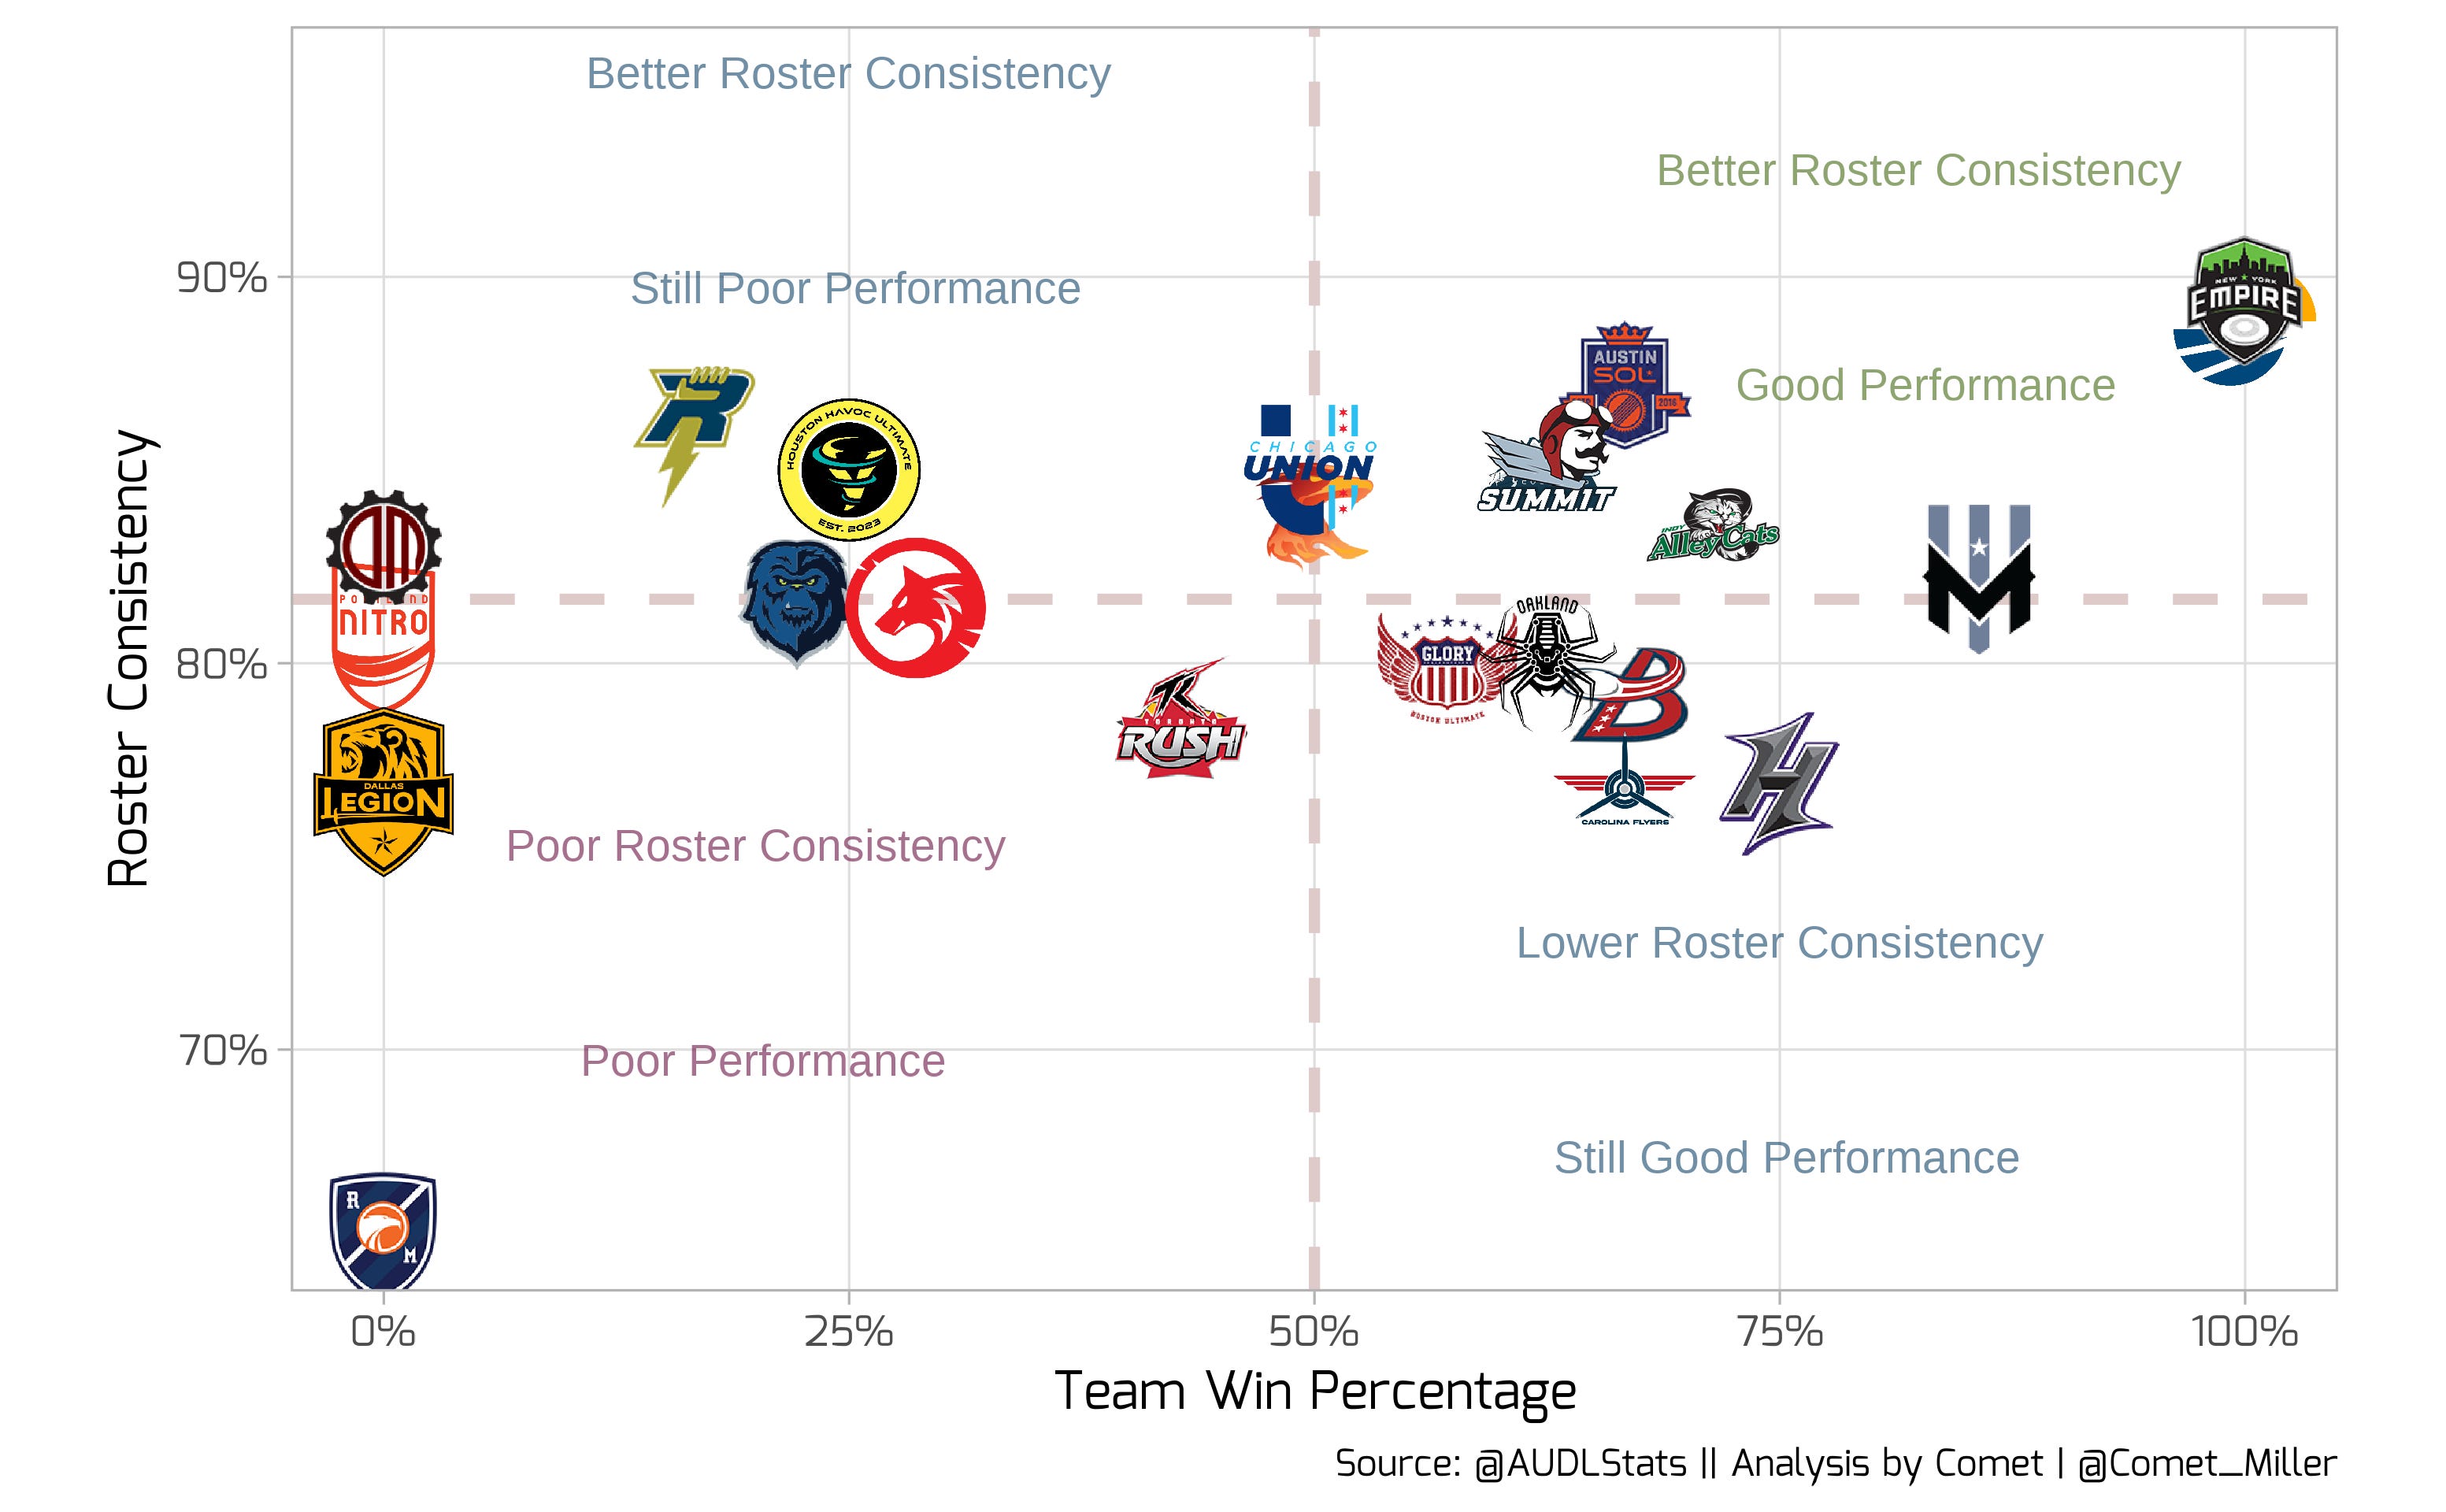
I've split the plot into four quadrants that may have meaning. In the bottom left hand corner we have teams that have high roster turnover and aren't winning very many games. In the upper right hand corner we can see the teams that are more consistent week to week and are playing well. In the other two corners we can see a mix of teams that are consistent but bad or inconsistent but still playing well.
In general, it does seem that there is a small positive correlation between roster consistency and winning percentage, but I'm not sure that the data is completely definitive on that.
Championship Weekend model update
Last week I introduced my Bayesian logistic regression model that predicts Championship Weekend attendees. For those who care, the updated probabilities after AUDL Week 8 are below.
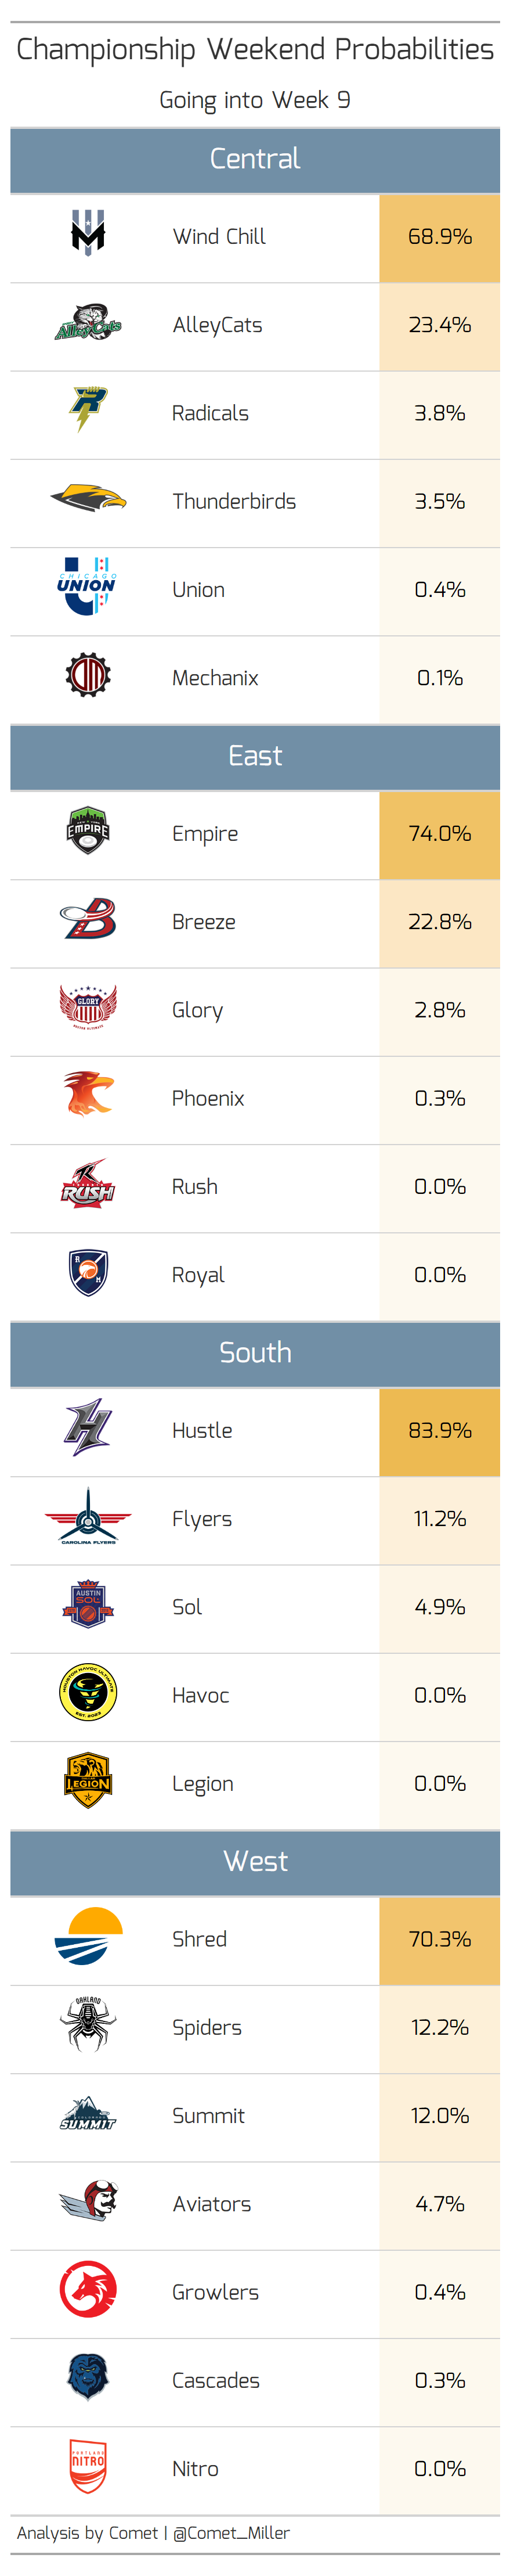
There wasn't a whole lot of movement, but it was interesting that despite some teams winning over the weekend (specifically the Wind Chill), their probabilities decreased, while the AlleyCats narrowly escaped a historically embarrassing loss to the Mechanix and saw their probability increase.
감사합니다
What do you think? Does roster consistency week to week matter in the AUDL?
Thank you to @AUDLStats for the stats and thanks for reading. Again, feel free to leave feedback or ask questions. You can find me on Twitter @Comet_Miller.
— 밀혜성
Question! Just to make sure I understand. Is everything measured against the opening day roster or is it recalibrated week to week?
For example: A team had players 1-20 play game 1. In game 2, they had players 1-18 and added 21 and 22. This would mean they had 90% roster consistency.
If in week 3 they have the same lineup as week 2, would that be 100% roster consistency for that week or still 90% because you are basing it all off of the week 1 roster?