
Team Strength Metrics
Strength of Schedule, Rating Percentage Index, and Pythagorean Wins

This week we are going to take a journey backwards in sports analytics and entertain some metrics and concepts that ultimate analytics never had the pleasure of experiencing. The most recent and current analyses in sports analytics jump right over these ideas because analytics has become significantly more sophisticated and statistically sound. However, because ultimate never had the pleasure to "grow up" analytically with the other major sports, this post will take the young sport out back, set up the ole vintage record player, and see if we can learn a thing or two about the past that can be applicable to the present and future.
In three short sections, we'll introduce and take a look at Strength of Schedule, Rating Percentage Index, and Pythagorean Wins. Warning: this week contains more tables than normal.
Strength of Schedule
One of the first things a fan will mentally adjust for when comparing games, seasons, or performances is the relative difficulty that a team had compared to others. Walking through records of teams and how difficult each win was in comparison to every other team is a routine method of engaging in endless debate on your favorite ESPN talk show. It's not all bad because doing so is certainly a full notch above the lack of sophistication in "my team is better than yours because we won more". Strength of Schedule (SoS) was created to take into account the schedule difficulty of each team. The most popular implementation of SoS was during the BCS era in college football (don't worry, I'm wincing too). It's calculated as follows:
It's a nice little equation because it's very straightforward and goes so far as to take into account the opponents of a team's opponents. This is valuable in a sport that does not have many games with equally balanced schedules. In this sense, an AUDL season is very similar to a college football season with few games and only a couple interdivisional games at most.

Above shows the results from the SoS calculations. Is it any surprise that Austin has, by far, the weakest SoS in the league?
Rating Percentage Index
Rating Percentage Index, or RPI, is another metric that attempts to do rate teams based on the same factors as in the SoS calculation, but also taking into account how strong that team is. The basic formula is below:
This metric has been used in college basketball for a long time. Again, better metrics and rating systems exist now, but this rudimentary one was (and probably still is) used to some degree in order to determine who got into March Madness. The weightings in the equation make it obvious how RPI is constructed, making team strength a quarter of its own rating and SoS three quarters of the rating.
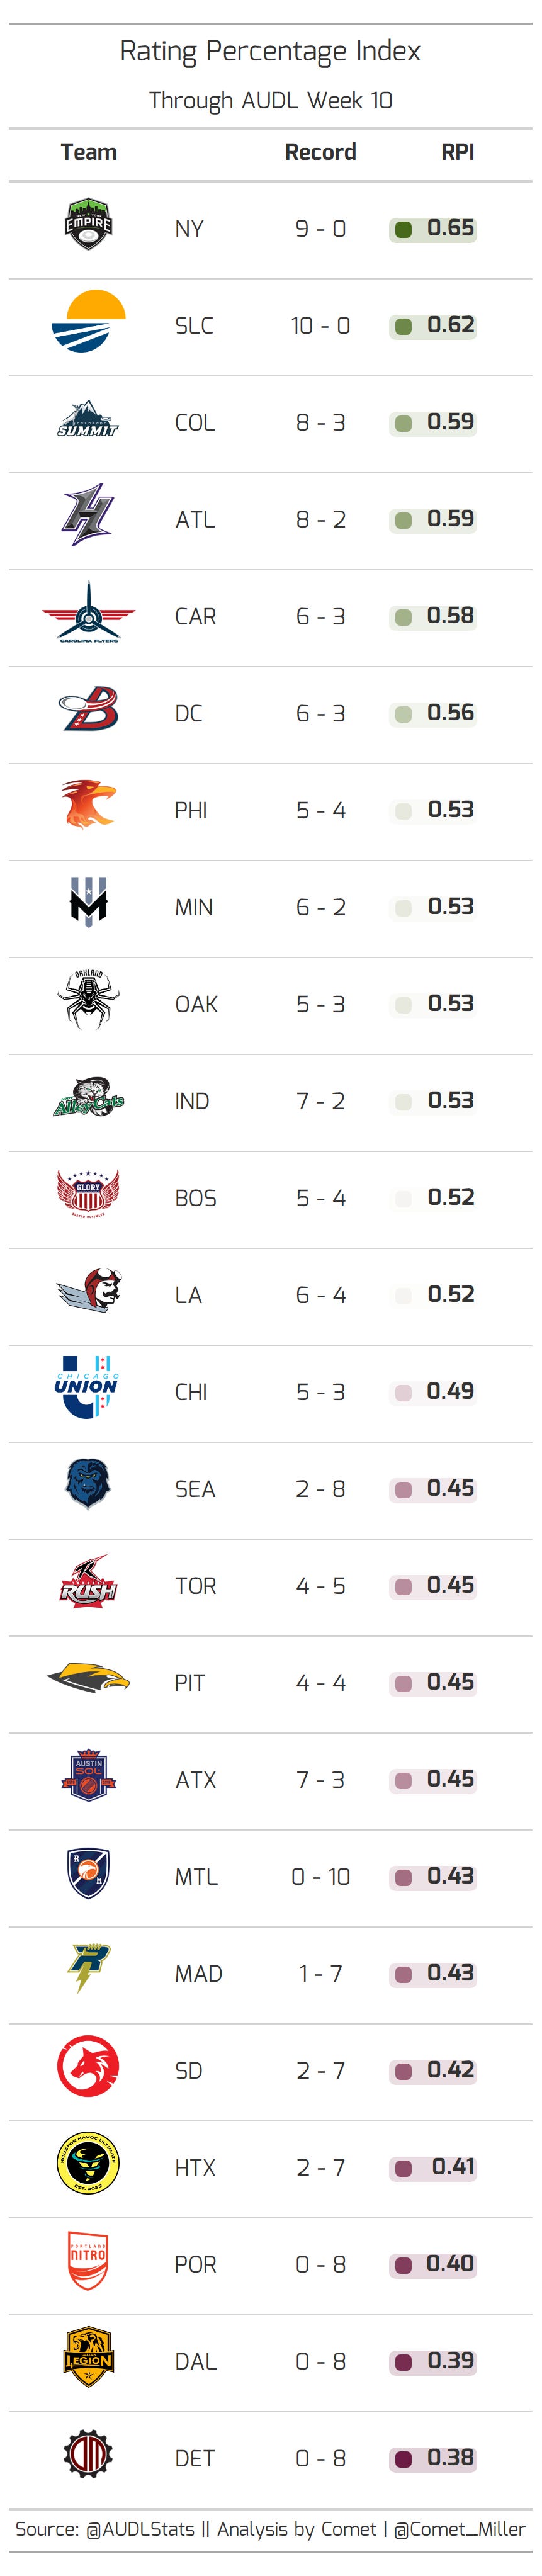
Upon first glance at this year's RPI in the AUDL so far, it actually feels quite accurate. Austin sitting just in between Pittsburgh and Montreal is a bit of a shocker to say the least, but for those soft-schedule Sol haters it gives a little bit of satisfaction.
Pythagorean Wins
Pythagorean Wins has been around since Bill James and is still commonly used, though there are now much better models that are used to predict team win percentage. It's a rough calculation, and, for each sport it tends to be consistently off a bit. However, it is known to give good overall estimates. Pythagorean wins is calculated by:
where x is the empirical exponent used for each sport (it changes). I took the liberty of calculating the best empirical exponent for AUDL games and it turns out to be about 6.86 (for reference, baseball is 1.83, basketball is 13.91, and football is 2.37). The formula gives estimated win percentages, so to get Pythagorean Wins you just multiply the total number of games by the estimated win percentage. Here's what that looks like for this season.
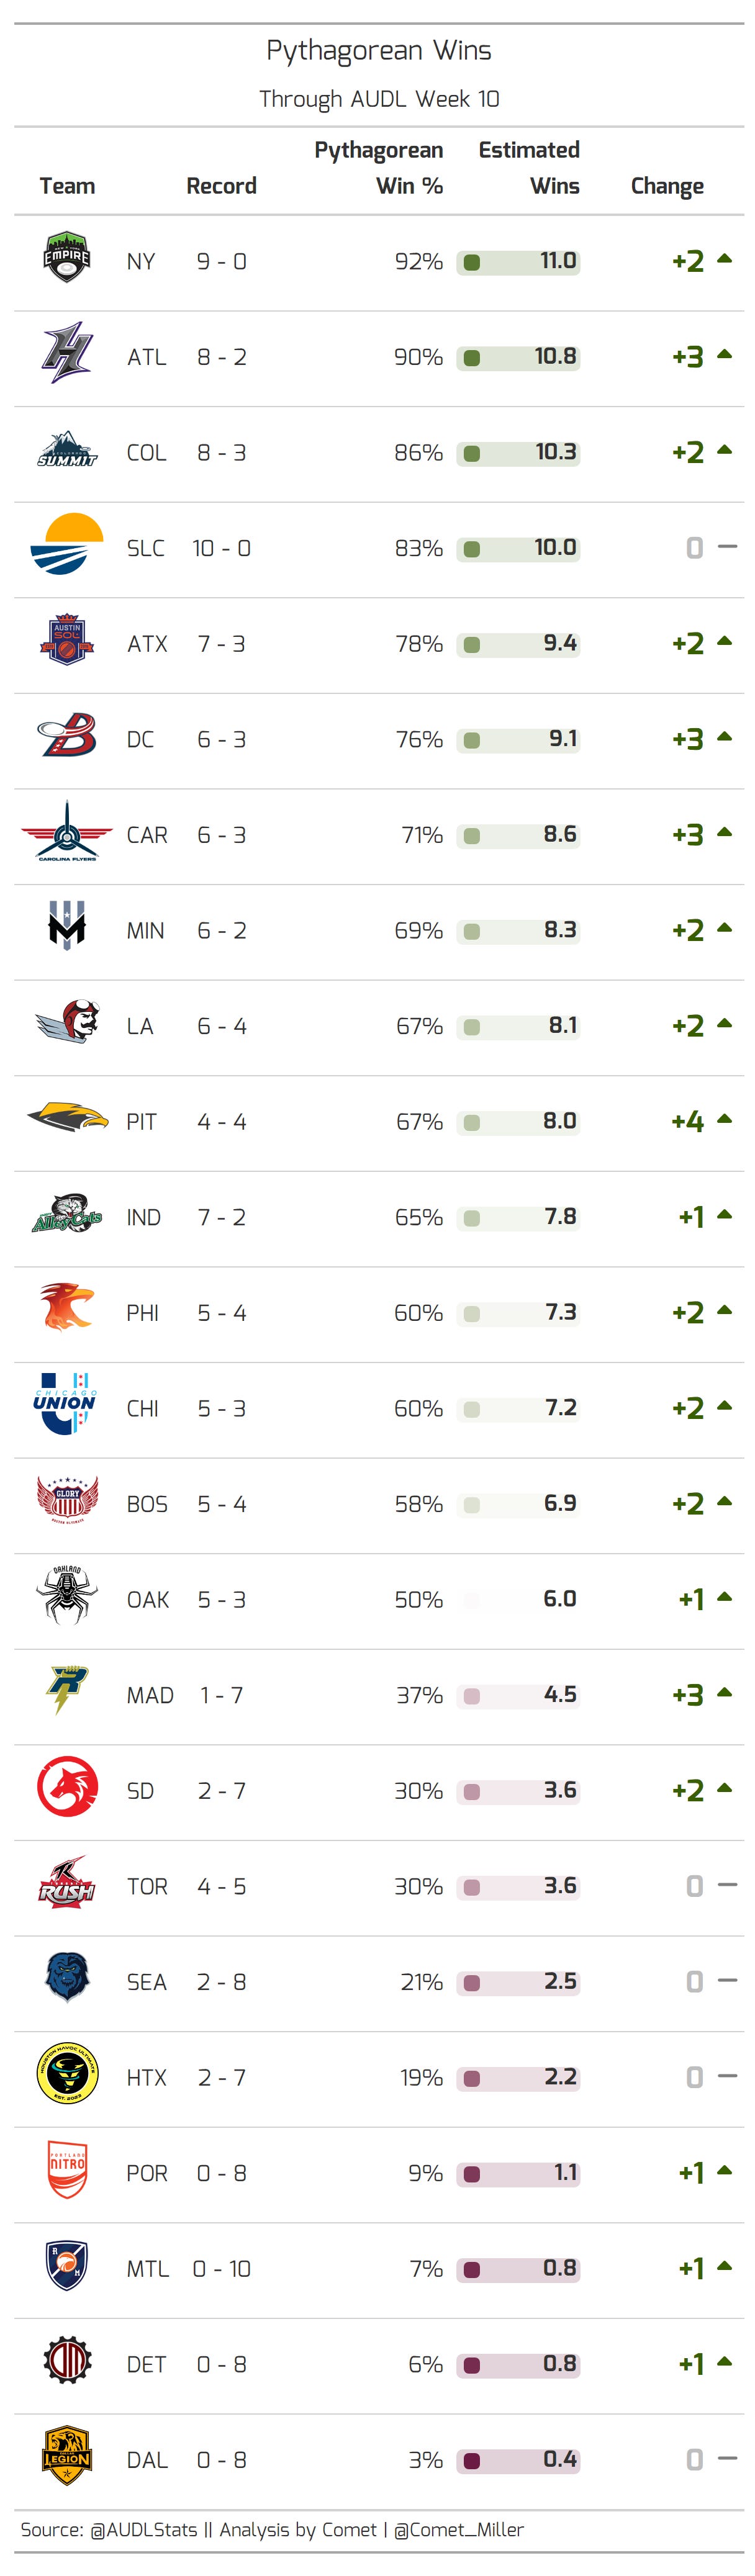
The table shows each team's estimated win percentage, the Pythagorean Wins, and how many more games each team is expected to win this season based on their current record. Based on points scored and points conceded, the Pythagorean Wins expects that Dallas continues winless on the year, but expects Pittsburgh to finish out with four straight wins. In general, people who work in sports analytics expect that a team that outperforms their Pythagorean Wins one season will regress backwards the next, while a team that underperforms on Pythagorean Wins will be more successful the next (this is also a representation of the general principle of regression to the mean).
Another way to look at this data is to plot Pythagorean Win Percentage with the current win percentages.

The Radicals also stand out as a team that is underperforming based on this metric; I personally wouldn't expect Madison to only have one win at this point next season either.
Conclusion
Finally, I aggregated each of these metrics into a sort of "ranking". A top ranked SoS means the team has the hardest schedule in the league, a top ranked RPI indicates high team strength, and a top ranked Pythagorean Win Percentage means they're expected to win a lot of games based on points scored and points allowed

.The table is arranged by average ranking on the right for an overall "best to worst" team ranking. While it's not perfect, it actually passes the smell test quite well with the better teams at the top and the worst teams near the bottom.
We were able to see from the above analysis that the metrics used are kind of elementary. But that doesn't make them useless. In fact, I believe they're good starting points for how to evaluate team strength without getting too into the weeds.
Championship Weekend update
Time for another update to the Championship Weekend model predictions. There seems to be more certainty about the AlleyCats and Empire winning their divisions but less certainty about the Shred
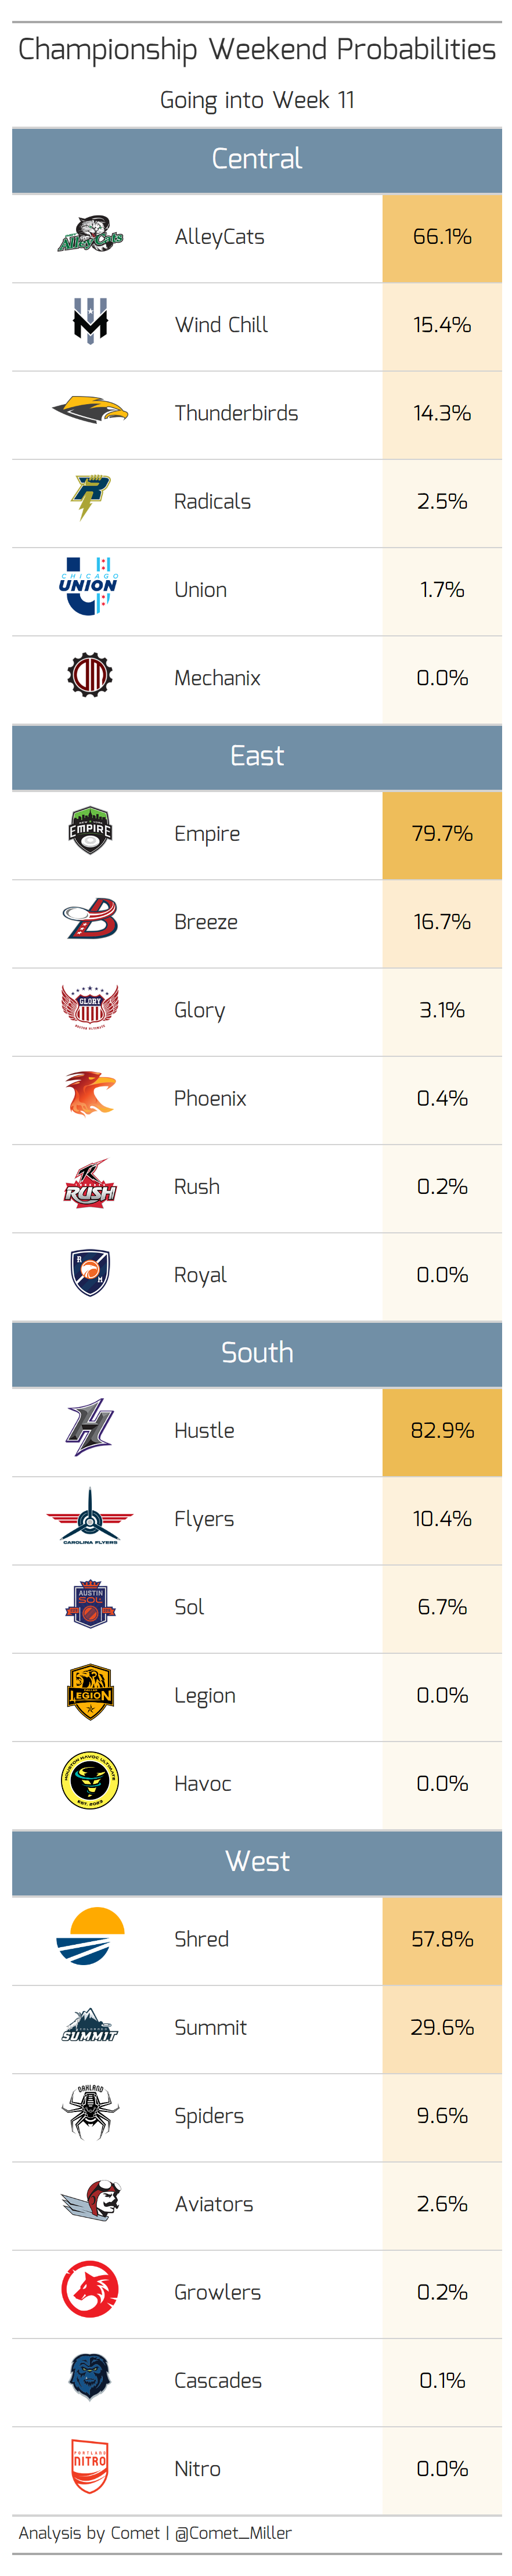
.It is surprising to see the Thunderbirds creep up to be neck and neck with the Wind Chill.
감사합니다
Which of the metrics is your favorite?
Data used comes from @AUDLStats. You can reach me on Twitter @Comet_Miller. Thanks for reading!
— 밀혜성